WestmarkTrading - Market Masters - Beating Next Year's Markets

Chapter 01

Roger Scott | WealthPress

Flash Crash - Fast Cash

  • How to trade extremely volatile markets
  • How my portfolio is always protected from market crashes
  • Why a systematic approach is best for 99% of traders

Chapter
01

Flash Crash, Fast Cash

By Roger Scott, WealthPress.com

A Systematic Way To Make Money, Even When Markets Crash

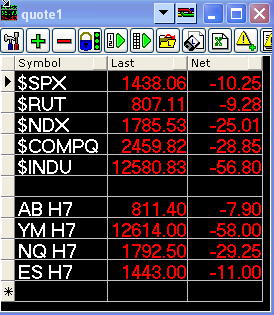
Markets have been on a wild and volatilite ride the past few weeks. 

And that’s been a major problem for traders and investors that were used to a mostly drama-free decade where markets moved higher and every dip was a buying opportunity.

Now, we’re seeing daily moves of 7%-plus in individual stocks to the upside and downside regularly. And often, these moves are happening while markets are closed and you can’t do anything about it.

Well, at least most traders think they can’t do anything about it. 

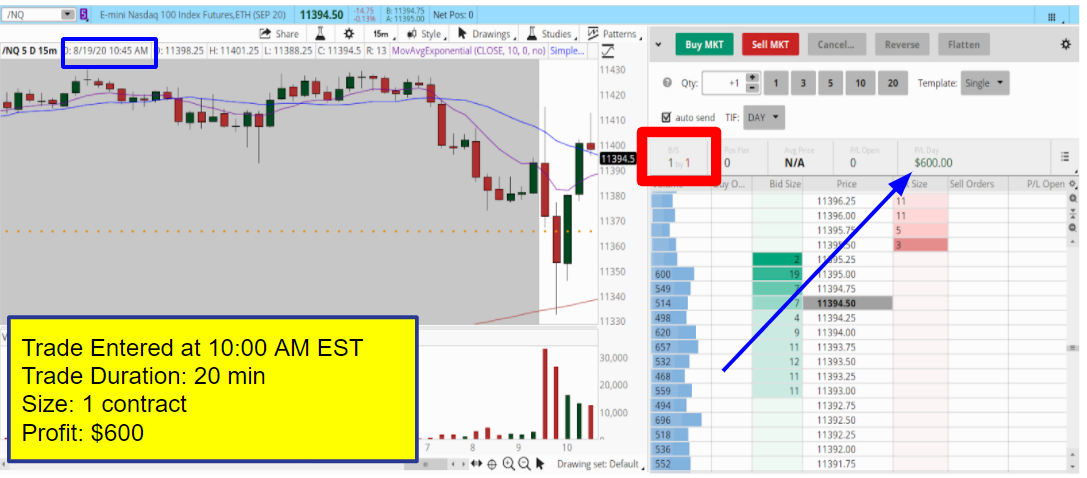
Today I’m going to give you an inside look at how my systems are navigating this market. It doesn’t have to do with timing a trade perfectly, it’s all about having the right stocks and securities in your portfolio and trading them in a disciplined way.

And these systems have proven to work in all markets -- I back-tested them with decades of market data and have been trading them live for years now. 

That includes the extreme volatile market we’re in now, which I expect to last for several months.

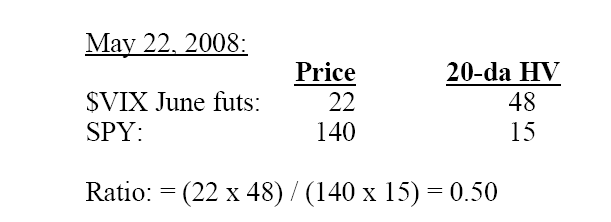
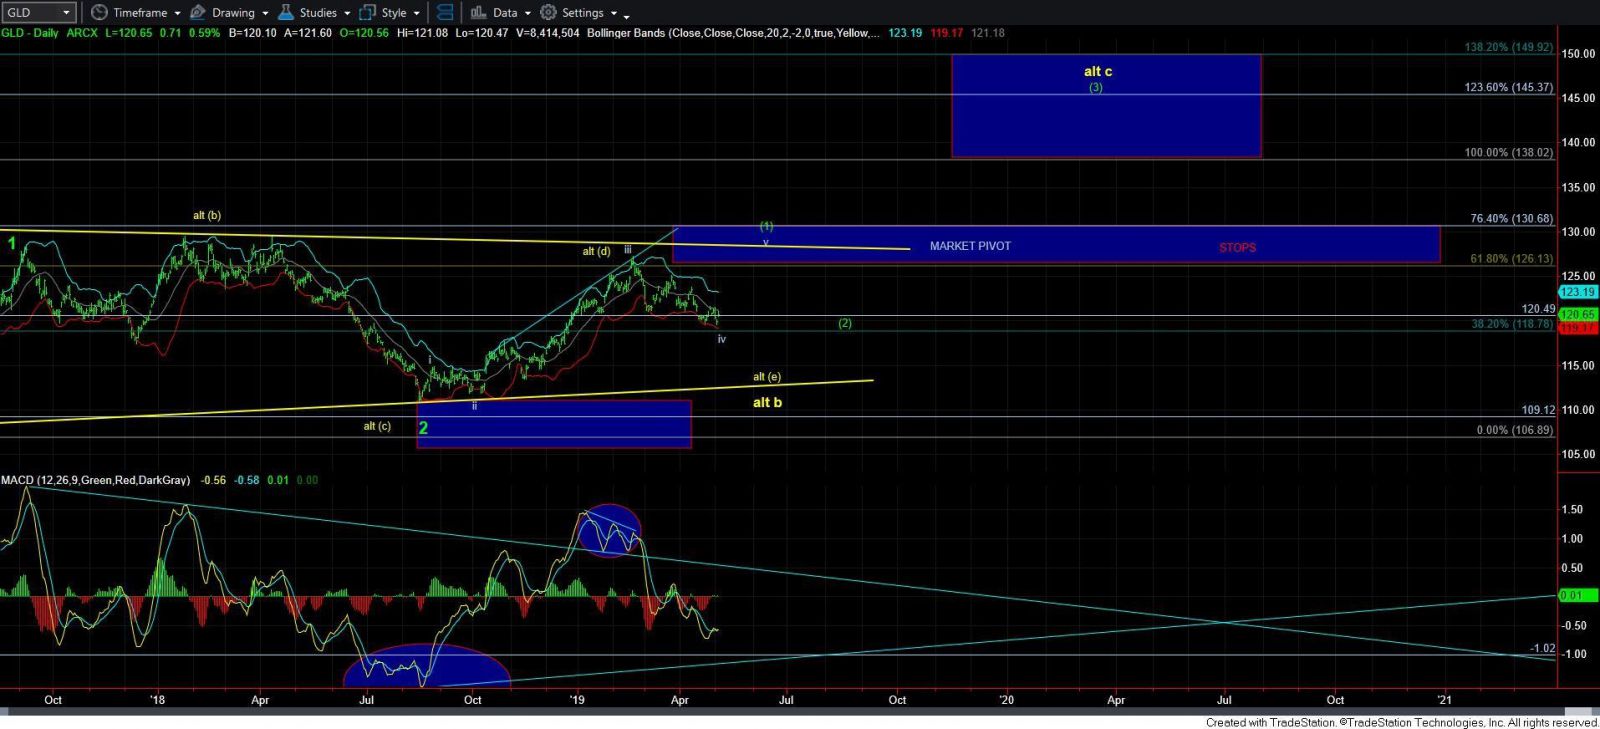
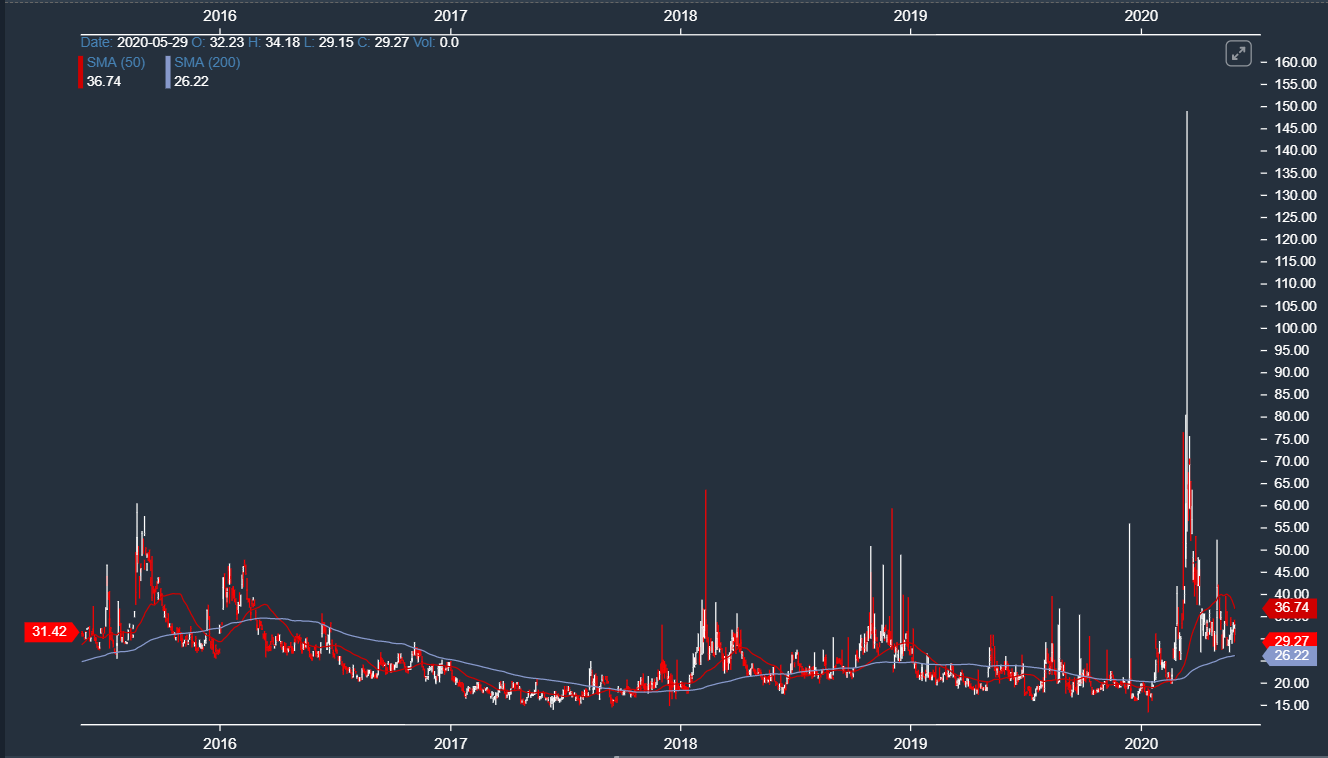
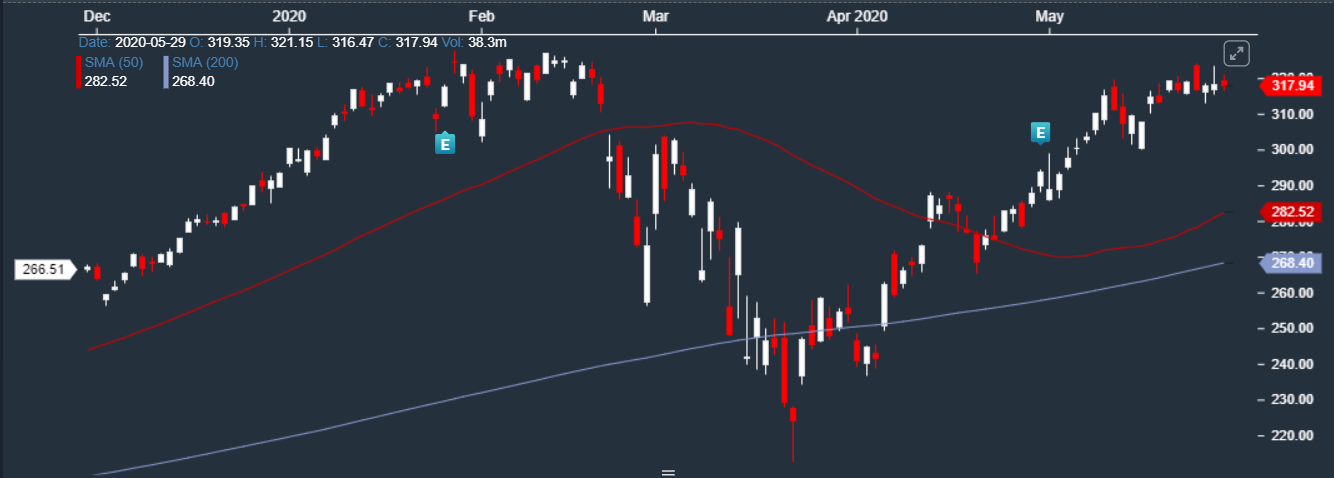
Check the chart below of the Volatility Index (VIX) to see what I mean...


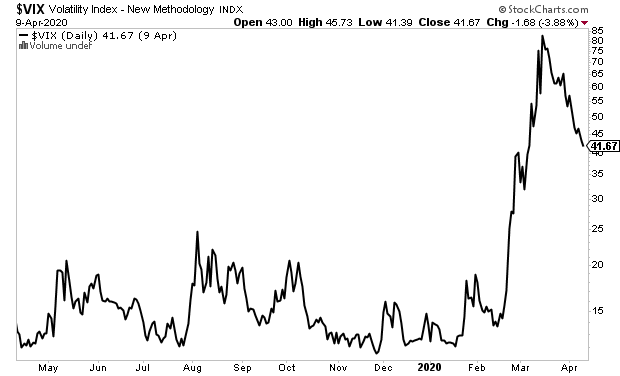
The index tracks the 30-day volatility of S&P 500 options. When it’s elevated, as it is now, it means the market expects more volatility, which increases the price of options.

But on a more practical level, it’s a quick visualization of market sentiment. When you see it spike the way it has recently, you can bet there’s market turmoil or uncertainty. 

That’s why the VIX goes by another name, too: The Fear Index.

Most investors hate to see elevated VIX levels. It often means their portfolios are down, and that’s when fear starts to set in and mistakes are made. Let’s just say there’s a strong correlation between the VIX spiking and friends calling me for market advice.

And while markets have rallied off their recent lows, there's still months of bad economic reports and earnings releases coming our way. Not to mention a recession.

This rally won’t continue uninterrupted for the next few weeks, much less the next few months.

So what’s a trader to do? You want to take advantage of the bounces, but don’t want to be left holding the bag when stocks inevitably pull back again. 

A Systematic Way To Make Money (And Protect Your Portfolio)

Markets have a way of pulling the rug out from under investors’ feet when they least expect it. And that’s when you find out “who has been swimming naked,” as Buffett would put it.

And based on some of the emails I’ve received, I know m

any traders have been skinny-dipping in the market. By that I mean trading without a hedge or not using proper risk-management techniques.

This simplest and most effective way I know to protect a portfolio is never being 100% long (or short) or owning assets that are not correlated to the market. 

You can’t predict when markets will fall 6% in two days, so it makes sense to always have something in your portfolio that’s likely to increase in value when markets get crushed.

Hedges might not sound “exciting” -- but what they can do for your portfolio are undeniable. There’s a reason why I build them into most of my trading systems. 

Alpha Trader, for example, is only in four positions at a time. It goes long three sectors ETFs it expects will outperform the market and shorts a sector ETF it expects to lag based on relative strength and other technical factors.

As you can imagine, my long positions were crushed along with everything else when markets collapsed in February.  But the short position more than covered my losses. 

Check it out for yourself:

February 14 - March 2
 

Ticker

Description

Trade

Allocation      

Return

XLK

Technology ETF       

Long        

20%

-72.7%

XLRE

Real Estate ETF

Long

25%

-62.0%

XLU

Utilities ETF

Long

30%

-73.1%

XLE

Energy ETF

Short

25%

455.2%

Total Return     


61.8%

S&P 500


-8.40%


As you can see above, my positions overall were able to deliver a massive 61.8% return over two weeks (that’s how long we hold positions before rotating into new ones).

That was thanks to our hedge, a put option on XLE which jumped 455.2% when stocks and oil prices collapsed. 

Markets continued to crash for the next two weeks, and again the system was profitable. While the S&P 500 fell 19.2% from March 2 through March 17, Alpha Trader delivered an 82% return.   

That’s not the only way to hedge a portfolio, of course. 

Nasdaq Titan, another top-performing system, buys the three blue-chip stocks most likely to outperform over a two week period and hedges the three long positions with a bond ETF. 

Bonds are an example of an asset that usually does the opposite of stocks. That’s especially true when stocks fall. And because I trade options on the bond ETFs hedge, the gains can be significant when markets fall.

From February 14 to March 2, for example, our bond ETF delivered a 341% return. Yes, my long positions took a hit during that time, but my hedge significantly softened the blow.

Best of all, Nasdaq Titan is now taking advantage of the current market bounce. That’s the advantage of using a system with a built-in hedge, it can profit in any market environment.

I hope the examples above help you see why hedges are so important. You might not always need them, but you’ll be glad they’re there when you do. 

Even with the hedges, my systems have proven that they can outperform in bullish markets as well. Having a hedge in place lets you stay in the market with confidence… The last thing you want to do is take a massive hit when stocks crash and sit on the sidelines as markets rally. 

THE SPECIAL OFFER

The Nasdaq Titan+  Program

You’re one click away from claiming the $2,000 Fast Cash Discount on the Nasdaq Titan+

Here's a recap of what you get:

  • 24 NASDAQ Titan+ Trade Clusters. You just have to act fast… There are only 50 spots available at our Fast Cash $2,000 Discount today… Then we must shut this offer down. Even our weakest trade examples offered $2,206+ winners. If you made that much 24 times a year, those trades would have a total value of: $52,944.
  • BONUS #1 The VIP Trade Room: Even MORE Trades As We Spot Them! Learn how to find these explosive trades on your own, even if you have a small account … You shouldn’t be surprised if your first VIP Trade Room trade returns 100%+. (Value: $2,999)
  • BONUS #2 The Profit Academy: Revealed. This video series isn’t available anywhere else in the world, and shows the inner workings of my NASDAQ TItan+ system and strategy. (Value: $999)
  • BONUS #3 12 Issues Of The Breakout Report. Stay on top of important activity in the broader markets like 5G, the cannabis boom, the future of fuel, ESG stocks and more with my exclusive monthly stock report. (Value: $1,999)
  • The Gladiator “No Risk” Guarantee. I want to you to earn up to $3,680 right away. If I fail to give you the chance to do this within the first 30 days, I’ll mentor you in my VIP Trade Room until you do! (Value: $3,999)
  • Private Members-Only Portal. Access to a private portal to keep track of our NASDAQ Titan+ activity and other private members-only perks. (Value: $299)
  • NASDAQ Titan+ Alert Hotline. This is like a direct line to my team and the perfect place to get your most pressing membership questions answered right away. (Value: $199)

ABOUT THE AUTHOR


Author: Roger Scott, Founder
Company: Wealth Press
Website: WealthPress.com
Services Offered: Trading Courses, Mentorship,
Markets Covered: Stocks, Options, Futures, Forex

Chapter 02

Larry Gaines | PowerCycle Trading

My Favorite Reversal Indicator

  • The key to trading consistency in any market environment
  • Why market direction is the key building block for success
  • Using the moving average indicator for trading reversals

Chapter
02

MY FAVORITE REVERSAL INDICATOR – THE MOVING AVERAGE CROSS

By Larry Gaines, PowerCycleTrading.com

After decades of trading, most all major markets, I've learned that the key to trading success, in any type of market environment, starts with market direction.

In this video, I'll show you a how to use the moving average indicator for trading market reversals and it works across all markets.

THE MOVIE: MY FAVORITE REVERSAL INDICATOR - THE MOVING AVERAGE CROSS


THE SPECIAL OFFER

If you would like to learn more about this chart pattern and my other favorites, along with the directional trading tools we use, at Power Cycle Trading then use the link below and you'll receive one month access to our Power Cycle Trading Club for free.

Power Cycle Trading Club

Here is what you will receive:

  1. Virtual Trading room – Open from 9:25 AM until 4:15 PM EDT
  2. Daily Market Update Videos for Day Traders and Swing Traders
  3. Live Weekly Q&A with Larry
  4. Trader’s Education Vault
  5. Monthly Award Points - $20 credit for each month of membership. (Credits can be applied to all current or future courses)
  6. 50% Discounts on All Courses & Trading Software

ABOUT THE AUTHOR

Author: Larry Gaines, Founder
Company: Power Cycle Trading
Website: PowerCycleTrading.com
Services Offered: Trading Courses, Bootcamps/Coaching, Custom Indicators
Markets Covered: Stocks, Options, Futures

Chapter 03

Dr. Barry Burns | Top Dog Trading

How to Avoid Choppy Markets

  • Why pro traders focus more on staying out of the market
  • Recognizing and avoiding consolidating market conditions
  • Five things I watch to determine condition of the market

Chapter
03

How to Avoid Choppy Markets

By Dr. Barry Burns, TopDogTrading.com

Most trading methods do make money when trading in perfect trending conditions, but then give back those same profits during periods of consolidation. So if you could learn to avoid consolidating markets, you could profitably trade many sound trading methodologies.

This Special Report from Top Dog Trading is designed to help you avoid choppy markets.

Although most traders spend years seeking new price patterns and indicators to help them know when to get into the market, professional traders spend most of their time working on filters to keep them out of the market!

I’m sure you don’t need me to convince you of that fact and give you a lot of background, statistics and paper-filler, so let’s jump right into the practical stuff.

There are 5 things I’m always watching that help me determine the “condition” of the market. Some apply only to day trading and others apply to swing trading and investing as well.

CONSOLIDATION SIGNAL #1: FLAT 50 SIMPLE MOVING AVERAGE

The teacher of my very first Futures course taught me this. He said as simple as it is, it would be the best thing anyone ever taught me.

When the 50 simple moving average if FLAT, that means the market is flat, and that means your position should be flat!

“If it’s flat, be flat, it’s as simple as that!”

Below is a 2 minute chart of the S&P emini. You can see that when the 50 MA (the red line) goes flat, it’s a clear indication that there is no trend in the market.

The 50 MA will have to be flat for a few bars when the trend is changing. Therefore this rule only applies when it has been flat for an entire cycle (use your favorite oscillator for measuring cycles).

CONSOLIDATION SIGNAL #2: USE TICK CHARTS

Most people use time charts, meaning that each new bar is created after a certain period of time: 2 minutes, 5 minutes, 1 day, etc.

“Tick” charts are charts that create a new bar after a certain number of TRADES are executed. A 100 tick chart starts a new bar whenever 100 trades go through and the 101st trade comes in.

During consolidation, volume tends to drop. Minute charts will continue to form new bars every minute, thus giving you long periods of consolidation on your chart and creating price patterns and indicator patterns you may be tempted to trade.

Tick charts, however, print fewer bars during periods of low volume consolidation because they only print new bars when the designated number of trades are executed through the exchange. Therefore you don’t see as much consolidation on your chart, thus removing some false signals and some temptation!

Below is a comparison of the exact same 2 hour period as it looks on a 2 minute chart and a 500 tick chart of the eminis.

CONSOLIDATION SIGNAL #3: FLAT ADVANCE/DECLINE LINE

One of the indicators you should always be watching, in my never-to-be-humble opinion, is the Advance/Decline line.

This is the difference between the Advancing and Declining issues. There’s one measurement for the NYSE and another for the NASDAQ.

Use whichever one (or both) that relates to the market(s) you trade.

The bottom line on this indicator is simple. Much like the 50 MA, when it goes flat, keep your account flat. It’s an indication that there is no clear direction in the market.

So the market may be trending, but if the Adv/Dec is flat, your “trending” market could change direction or simply go flat at any moment.

For day trading I use a 2 minute chart of the Advance/Decline line.

When I say “flat,” that is a relative term, as it is with the 50 MA. With the 50 MA I’m looking at the angle of the line, but with Adv/Dec I’m plotting price bars and looking for a clear trend of higher highs/ and higher lows.

CONSOLIDATION SIGNAL #4: FLAT UP/DOWN VOLUME

Here’s another one of my favorites, and I don’t know many people who use this. Hint: that’s called an “edge” for you and me!

It’s the up/down volume. It measures the difference between the up volume and the down volume, as opposed to the difference between the number of issues up verses down. Again, it’s available for both the NYSE and the NASDAQ.

The key is to watch the relationship of the bars to the zero line (I draw it in as a horizontal line on my chart).

If the bars simply hover around the zero line, that’s an indication that there isn’t any strong commitment of traders in either direction today, and therefore you may have a choppy, trendless market or a trend that is in place is less likely to continue following through.

Sometimes the Advance/Decline line will be trending, but if the Up/Down Volume is not trending, then be careful! There may be more issues going up than down, but there isn’t volume to support the move!

There’s no commitment of volume in either direction this morning. This indicates “choppy weather conditions” on the sea of trading.

To twist a quote out of context: You don’t have to be a ‘rocket surgeon’ to figure out what the low-risk trading direction is during this volume activity!

CONSOLIDATION SIGNAL #5: INTER-MARKET BIFURCATION

The final sign of a potentially choppy market is when the major indices get out of alignment.

If you’re trading the DOW, or a DOW stock, and it’s trending up nicely, but the NASDAQ is negative for the day, the NASDAQ may have a negative pull on the DOW and hinder its ability to continue trending.

You want to watch to see if the markets are splitting any of the following levels:

  1. Yesterday’s Close.
  2. 50 MA
  3. Central Pivot

“Splitting” any of these 3 levels, means that one of the four markets is above and another is below.

For example, if the S&P is above its close from yesterday, but the NASDAQ is below its close from yesterday, then the overall market condition would be considered “bifurcated.”

Another example: If the DOW is above its Central Pivot, but the S&P is below its Central Pivot, then the overall market condition is considered “bifurcated.”

Although one market will always be stronger than another market, the strongest trending days usually occur when all 4 of these markets are clearly bullish or bearish. When the markets all move together, they move more freely and tend to follow-through more … sometimes trending in one direction for the entire day.

I like to have a quote screen with the following markets at the top:

  • S&P
  • Russell
  • DOW
  • NASDAQ
  • NDX
  • ES
  • ER2 (or AB)
  • YM
  • NQ

On the quote screen I include a column for “Net Change” from yesterday’s close. This allows me to see in an instant if the markets are aligned with yesterday’s close.

  • If they’re all red, then they’re all below yesterday’s close.
  • If they’re all green, then they’re all above yesterday’s close.
  • If some are red and some are green, then the markets are bifurcated.

In the quote window below, all the markets are aligned to the downside, with all of them below their respective “yesterday’s lows” for both Cash and Futures.

THE SPECIAL OFFER

As a Special Bonus for those who read this article, you’re entitled to get one of my Mini-Courses for free. It’s entitled:

“Make Money by Breaking Every Trading Rule You Ever Learned”

… and you can get it free by clicking the button below.

Get this free, actionable video, and you'll learn my favorite trade strategy in about 6 minutes!

FREE BONUS when you get the strategy: "The Rubber Band Trade" ...

... You'll also get my first course for free, entitled "How Professionals Trade Different Than  Amateurs." 

Ever wonder why all the stuff you've learned in books and courses don't work? EASY ANSWER: Because the pros trade by different rules. 

Just a few things you'll get from this free course:

  • "Trend Lock Technique:" How to always be on the right side of the market. 

  • How to find the best markets to trade right now.

  • No more overwhelm - How to trade effectively with just 5 crystal-clear and super-simple steps. 

  • Stop being stopped out! The ONLY correct place to position your stops to avoid "stop running." 

  • How to time your Entries and your Exits with amazing accuracy and precision. You'll always know EXACTLY where to Enter and Exit. 

ABOUT THE AUTHOR


Author: Dr. Barry Burns
Company: Top Dog Trading
Website: TopDogTrading.com
Services Offered: Trading Education, Free Videos, Books
Markets Covered: Stocks, Options, Futures

Chapter 04

Gavin Holmes | TradeGuider

Trading in the Market’s Footsteps

  • Learn to focus on what professional money is doing
  • Uncover the true market sentiment before you invest
  • Use Volume Spread Analysis for high probability trades

Chapter
04

Trading in the Market’s Footsteps

By Gavin Holmes, TradeGuider.com

Knowing how to read the market will allow you to take the professional's lead and boost your profits. Understanding professional moves will allow you to uncover the true market sentiment. It will give you a clear indication of which markets you should hold positions in ‐ whether buying or selling stocks, or going long or short on futures, FOREX or commodities.

The professionals can never hide their true intentions if you can learn to analyze a chart like they do. They may be leading the market, but they leave tell‐tale signs for anyone with the right knowledge to follow. The only truly important consideration for you is what the professional money is doing ‐ that is the only thing that matters, and then you follow in their footsteps.

By using and understanding TradeGuider and the Volume Spread Analysis methodology you will learn how to read any market like a professional, knowing if a market is behaving strong or weak, and identify high probability trade set ups for continued long term success as an occasional or full time trader.

VIDEO PRESENTATION: TRADING IN THE MARKET'S FOOTSTEPS

THE SPECIAL OFFER

Learn How to Become a VSA Trader.

Visit our website and learn how to trade in harmony with the Smart Money.
Get full 
access to all you need to learn to trade using Wyckoff VSA -  educational videos, PDFs, eBooks and courses. No software package required.

ABOUT THE AUTHOR


Author: Gavin Holmes
Company: Trade Guider
Websitewww.TradeGuider.com
Services Offered: Trading Education, Books, Videos, Trading Alerts
Markets Covered: Futures, Forex, Stocks

Chapter 05

Geof Smith | Diversified Trading Institute

Solar, Currency, or Gold - Which One Wins?

  • Will the rally in solar stocks continue?
  • Is the US Dollar going to be bullish or bearish?
  • Should we be buying on gold’s weakness?

Chapter
05

Solar, Currency or Gold - Which One Wins?

By Geoffrey A. Smith, DTItrader.com

Regardless of who wins the 2020 Presidential Election, the Renewable Energy markets appear well positioned to start heading higher with a focus on solar, batteries, and other more overall efficient technologies. The Fossil Fuel markets have been hard hit by decreased demand during the Global Pandemic shutdown and climate change pressures, but may also see some stimulus, especially if President Trump is re-elected.

Currency Markets, with a specific focus on the USD, have been lively largely due to past COVID stimulus programs and the potential for another stimulus package in the near future. These stimulus efforts have weakened the USD against other prominent currencies, and will this lead to an inflationary trend or potential depression?

The Gold markets will also be affected by the same external events that drive the currency markets. Additional stimulus programs and a weakening dollar are all situations that will drive gold prices higher, especially as hedge against increased inflation potential.

VIDEO PRESENTATION: SOLAR, CURRENCY OR GOLD - WHICH ONE WINS?

THE SPECIAL OFFER

eBook: "The Ultimate Guide to Becoming a Profitable Options Trader" 

  • Discover Geof’s Method Of Producing Income With Options
  • Learn DTI’s Famous Horse Race Trade
  • From Beginner to Advanced, This Book Covers Everything You Need To Know To Be A Profitable Options Trader

Get the eBook for just $7 by clicking on the button below.

ABOUT THE AUTHOR


Author: Geoffrey A. Smith, Chief Instructor and CEO
Company: Diversified Trading Institute
Website: DTItrader.com
Services Offered: Trading Education,  Software, Trade Alerts
Markets Covered: Stocks, Options, Futures, Forex

Chapter 06

Richard Krugel | Price Action and Income

Plug and Play Profit Signals

  • How to generate better profits by actually trading less
  • Finding trades and multiple entry points in any market
  • Leverage critical gains to grow your account on autopilot

Chapter
06

Plug and Play Profit Signals

By Richard Krugel, PriceActionandIncome.com

As you know, it’s been a tough year for the markets, which has left traders and investors in various states of grief:

Fear, denial, anger, bargaining, depression…

For better or worse, we’re witnessing historical market conditions -- but how do we end up on the right side of it?

That’s where Market Geometry comes in (it’s the science of how price moves, and why).

In this new video, I’m giving you a sneak peak at what’s been working for me (my members are up over 300%), plus my outlook for what lies ahead.

You’ll even pick up a few techniques you can apply to your own trading right away…

SHORT VIDEO PRESENTATION:PLUG AND PLAY PROFIT SIGNALS

THE SPECIAL OFFER:

Get My Plug-And-Play Profit Signals Here!

*SALE* Trade Forecasts: Get Your Second Year FREE

  • 2 Weekly Plug-and-Play Profit Signals
  •  5 Weekly Trade Forecast Reports
  •  Economic News & Timely Updates
  •  Instant Alerts & Private Telegram, and
  • LIVE Members-Only Briefings for TWO full years.

ABOUT THE AUTHOR


Author: Richard Krugel
Company: Price Action & Income
Website: priceactionandincome.com
Services Offered:Training Courses and Trade Alerts
Markets Covered: Forex. Futures, Options

Chapter 07

Stephen Bigalow | Candlestick Forum

The T-Line: An Uncommon Indicator

  • Benefits of staying on the right side of a trending market
  • How to leverage the T-Line and candlestick buy signals
  • Simple rules for entering and exiting a trending market

Chapter
07

The T-Line: An Uncommon Indicator

By Stephen Bigalow, CandlestickForum.com

Producing remarkably consistent profits with candlestick signals

Candlestick analysis was developed using one of the most reliable and consistent price movement indicators – human emotions. The Japanese rice traders identified signals and patterns that consistently occurred because of human nature. Investor sentiment has not changed over the past 400 years and will not change over the next 400 years. Candlestick analysis also has another compelling facet, is merely common sense put into a graphic depiction. For many investors, when learning the candlestick signals and patterns, and the investor sentiment that created those patterns, a very striking revelation occurs. The common reaction is “ yeah, I knew that”. Everything built into a candlestick chart is merely common sense.

Candlestick signals illustrate what is occurring in investor sentiment. They have proven to be very accurate indicators. There is an additional relatively unknown indicator that dramatically improves the results of candlestick signals and patterns – the T line.

Prices do not move based upon fundamentals! Prices move based upon the perception of fundamentals. When an investor understands this basic concept, they gain a much stronger perspective on when prices are reversing and also analyzing when price trends will continue. The Japanese rice traders use very simple parameters to show when a reversal is likely to be occurring. Simply stated, if you see a candlestick bullish reversal signal in the oversold condition, the probabilities dictate that an uptrend is about to occur. The same analysis can be applied to a sell signal. If you witness a candlestick sell signal in the overbought condition, the probabilities indicate a downtrend is about to start.

Utilizing those parameters creates a trading strategy that greatly improves investors profitability. First, if candlestick signals and patterns did not work, we would not be looking at them hundreds of years after their development. The Japanese rice traders, that created candlestick analysis, did not become  wealthy, they became legendarily wealthy. They were the financial powerhouse in Japan for centuries. And they created this wealth on the most boring trading commodity in the world – rice. Secondly, an investor understanding the highly profitable probabilities of price movements, based upon candlestick signals, is now in a position to trade by taking out the emotional decision-making process most investors apply. Where do most people buy? They buy exuberantly at the top! Where the most people sell? They panic sell at the bottom!

Have you ever wondered why when you became confident enough to start buying a position, as soon as you buy it goes the opposite direction? That is normal human investment decision-making. When the pain of holding a down trending position gets so great you can’t stand holding the position anymore, you sell? But as soon as you sell, it immediately starts reversing and heading back up. That is normal human investment nature. Ask yourself, when everybody else is selling, who is buying? When everybody else is exuberantly buying, who is selling? The smart money!

Candlestick charts graphically reveal exuberant buying at the top and panic selling at the bottom. If you understand that is the case, logic dictates watching for candlestick bullish signals at the bottom, and be ready to buy with the smart money or witnessing exuberant buying at the top of a trend should prepare an investor to get ready to sell.

A major attribute of candlestick signals is being able to see what investor sentiment is doing at observable technical levels. Major moving averages, trend lines, recent tops or bottoms, or any technical indicators that is being used by other investors become levels that candlestick signals reveal what investors are doing at those levels. This allows the candlestick investor to see exactly what the decisions are at those technical levels. But the most powerful trend indicator used in conjunction with candlestick signals is the T line.

The T line

The T line is the 8 exponential moving average. In produces a very effective trend strategy. The T line rule. If you witness a candlestick buy signal and a close above the T line, you can stay long as long as there is not a candlestick sell signal and a close back below the T line. Conversely you can go short if you see a candlestick sell signal and a close below the T line. This is an extremely high probability result. Confirm this for yourself. Put the 8 exponential moving average/T line on your charts. It can be easily back tested by visually analyzing what price trends have done after a reversal signal and a close above or below the T line. Also, be aware of a caveat to that basic rule. The further away you move from the T line, the higher the probability prices will come back and test the T line area.

The accuracy of the T line support and resistance implies a viable concept. The T- line has Fibonacci characteristics. It acts like a natural support and resistance level of human nature. This makes the T line indicator an extremely powerful trend indicator when used with candlestick signals. Why? If candlestick signals and patterns are the accumulative knowledge of everybody buying and selling during a specific time frame, the graphic depiction of what is occurring in investor sentiment and the T line is the natural support and resistance level of human nature, the combination is an extremely powerful trading technique. This is the most important statement of this e-book!

The T line rule - the formation of a candlestick buy signal and a close above the T line produces extremely strong probabilities an uptrend has been confirmed.

The formation of a candlestick sell signal and a close below the T line produces very strong probabilities the bears are now in control.

When prices move dramatically away from the T line, the probabilities are highly likely for the price to come back and test the T line. This enhances price reversal analysis. Witnessing prices that have moved excessively lower in a downtrend, well away from the T line, the higher the probability when witnessing a candlestick reversal signal implies a reversal will occur with the first target being the T line.

When to take profits? This is an area that most investors have problems. Candlestick analysis produces visual indications of when the probabilities favor taking profits. Witnessing a candlestick sell signal in the overbought condition is a likely reversal, be prepared to take profits on the signal’s confirmation. A greater profit taking indication is witnessing potential reversal signals at a top of a trend that have moved well above the T line. The further price moves away from the T line, the higher the probabilities the price will come back to test the T line. This scenario works very effectively because it is based upon what normally occurs in human nature.

The T line – Enhancing trades set ups.

The T line is a natural support and resistance level of human nature, identifying a candlestick pattern set up becomes much easier. Patterns, such as the J Hook pattern can be recognized much faster when seeing the price is not able to close below the T line. This allows the candlestick investor to be prepared for the next strong price move of a pattern. If it can be recognized that a profit-taking pullback after a strong uptrend is supporting at the T line, the prospects of a J-Hook pattern set up is highly likely.

The bobble pattern provides further credibility that a J Hook pattern is setting up. The first evidence of a bobble pattern is a failure at a visible resistance level, a major moving average. The pullback is then supported by the T line. Further evidence of supporting on the T line is the appearance of indecisive trading days, Doji’s, spinning tops, small hammer signals. This provides visual evidence that a bobble breakout is likely to occur if the price can’t breach below the T line. The appearance of bullish candles after those indecisive signals creates the expectation of prices   coming back up through the initial resistance level, creating a J Hook pattern. The resistance level makes for   a much more defined J Hook pattern. If you took the resistance level off the chart and obvious J Hook pattern is in progress.

The probabilities of an uptrend remaining in progress is greatly enhanced as long as the price continues to trade above the T line. When a price is heading toward a resistance level, the probabilities of the uptrend continuing with also the prospects of a breakout through the resistance level. The price continuing above the T line into the resistance level is called a T line crunch.

A major benefit of using the T line has a trend indicator is keeping emotions out of a trade. A candlestick buy signal and a close above the T line creates   high probability trades set up. It also provides a trading format for greatly improving profitable trades. One of the major flaws for most investors is having a profit in a trade. The fear factor sets in. The rationale becomes “I better take profits. I don’t want to look stupid by letting a profitable trade turn into a loss.” Utilizing the probabilities of the T line, an investor can make better trade decisions knowing what the trend is doing. Merely taking profits for the sake of taking profits offsets the often-heard advice of cutting your losses short and letting your profits run. The T line becomes a high probability factor for knowing when to continue to hold a trade versus taking profits to early.

An investor’s discipline becomes enhanced knowing what the probabilities are when using the T line as a trend support or resistance level. Remember the simple T line rule. Upon seeing a candlestick buy signal and a close above the T line, the uptrend will continue until there is a candlestick sell signal and a close below the T line. The combination is important. There will be candlestick sell signals during an uptrend but they will not be confirming the bears are in control unless there is a sell signal AND a close below the T line. Remember, the caveat to that rule is when prices move too far above the T line and a sell signal occurs, the prospects for taking profits become greater with the expectation the price will move back down to the T line. At that point, and investor can always analyze whether a new bullish pattern, such as a J Hook pattern is forming.

The most powerful trading technique is utilizing a combination of candlestick signals in conjunction with the T line. The reason candlestick charts have been around for hundreds of years is because they work. A basic rule of Wall Street is if something doesn’t work for effective trading, it disappears very quickly. The T line has very high probability results. This is something an investor does not have to take for granted. Putting the 8 exponential moving average on your charts  can be back tested very easily. Simple visual analysis will illustrate whether the T line produced effective trend results when scrolling back through charts.

Once in investor understands the candlestick signals are high probability graphics of changes in investor sentiment and the T line acts as a natural support and resistance level of human nature, they will now have the same perspective of what moves prices as in investor who has been in the markets for 50 years. Where does the smart money buy? They buy at the bottom when everybody else is selling. Where does the smart money take profits? When everybody else is buying exuberantly at the top. Being able to identify candlestick buy signals at the bottom of a trend puts in investor into positions where the probabilities are greatly in their favor that an uptrend is starting, buying with the smart money.  A bullish position can be maintained as long as the trend stays above the T line. When is it time to go short? Witnessing a candlestick sell signal in the overbought condition and a close below the T line. As an investor learns how to utilize the combination of candlestick signals and the T line, trade profitability will be greatly improved and emotional investment decisions will be eliminated. Candlestick signals and patterns are the accumulative knowledge of everybody buying and selling during a specific time frame, the graphic depiction of what is occurring in investor sentiment and the T line is the natural support and resistance level of human nature, the combination is an extremely powerful trading technique.

THE SPECIAL OFFER

Want to see Steve’s newest discovery? Then check out his new special report entitled "The Bobble / T-Line Crunch: A Little-Known, Extremely High-Profit Pattern Setup."

The Bobble Pattern and the T-Line Crunch

Now, the Bobble Pattern and the T-Line Crunch… like each and every one of Steve’s new High Profit Pattern Setups… have two things in common.

First, like everything else Steve teaches, these patterns are very simple to understand. They are easy to spot and immediately recognize with a glance at the chart, once you understand the parameters.

Second, these patterns exploit certain indicators and other charting tools that almost every trader on the planet uses in their everyday trading.

I’m talking simple moving averages, trend lines, trend channels, etc.

BUT… here’s the key difference, and what makes these new patterns so powerful…

Steve Discovered That Certain Combinations Of Candlestick Patterns With These Other Simple Indicators Can Create The Highest Probabilities For Profits He Has Ever Seen!

ABOUT THE AUTHOR


Author: Stephen Bigalow
Company: Candlestick Forum
WebsiteCandestickForum.com
Services Offered: Trading Education, Books, Videos, Webinars, Indicators, Live Trading Room
Markets Covered: Options, Stocks, Forex, Futures

Chapter 08

Larry McMillan | Option Strategist

The VIX-SPY Option Strategy

  • Favorite hedging strategy for high volatility markets
  • Realizing sizable profits regardless of market direction
  • Examples of this strategy performing in today’s markets

Chapter
08

The VIX-SPY Option Strategy

By Lawrence G. McMillan, McMillanAsset.com

This article was originally published in The Option Strategist Newsletter Volume 17, No. 20 on October 24th, 2008 but still remains relevant today.

In the beginning of volatile time periods, one of the more profitable strategies has been the $VIX/$SPX hedged trade.  We have recommended it several times in many of the newsletters that we write.  Many of our readers have asked for more information on the strategy, as it is either new to them, or they haven’t tried to use if before.  So this article will describe the strategy in detail – discussing its basic concepts, determining how many options to trade on each side of the hedge, and finally how to handle follow-up strategies.

The hedged portion of the trade comes from the fact that, in general, $VIX goes up when the stock market goes down (and vice versa). Hence a purchase of similar options (puts or calls) in both instruments is a hedged trade.  For example, in theory if one owns calls on $VIX and also owns calls on $SPX (or more likely, on S&P SPDRS [SPY]), they hedge each other.  Similarly, if one owns puts on both, it is a hedged position. 

Furthermore, we like hedges in which options are used because one has two chances to make money: 1) if the hedge converges, or 2) if prices of the underlyings move a great distance, for on one side, the call can only lose a fixed amount, while on the other side, the call can profit handsomely.  To verify this, consider the following simple example:

Example: Suppose the following prices exist:

Nov $VIX futures: 42
$VIX Nov 40 call: 7
SPY: 90
SPY Nov 90 call: 7

Suppose one buys both calls (for simplicity in this example, assume just one of each is purchased). Later, the market falls sharply, and SPY plunges to 75. The SPY calls can lose, at most, 7 points since that was their cost. 

Meanwhile, the Nov $VIX futures rise to 65. The $VIX calls can gain substantially as $VIX rises.  In this case, they would be worth at least 25 (since they’re 25 points in the money).

So, did the spread between $VIX and SPY “converge?”  Probably not, but the second way to make money kicked in: the underlyings were extremely volatile.

The Basic Concept

We don’t establish the hedge at any old time, even though the inverse relationship between $VIX and $SPX always exists.  Rather, we use the relationship between $VIX and the front-month $VIX futures as a “trigger.”  When that differential is too great – either “too much” of a premium or “too much” of a discount – the trade is viable.

In less volatile time periods, we often would establish this strategy when that differential reached 2.0 points or more – either a 2-point discount or a 2-point premium.  Recently, with the extreme dislocations in the broad market and the acceleration of volatility, there have routinely been differentials of 8 points or more between $VIX and the front-month futures.  So, as a general rule, we want to establish the strategy when there is a “sufficiently” large difference between $VIX and its front month futures contract.  Eventually that differential must disappear – certainly by expiration, if not before.

Speculators might remember that such a condition usually precedes a broad market move, not necessarily a movement in $VIX.  Discounts on the futures have often led to market rallies, while premiums on the futures have been harbingers of market declines.

However, those speculators were dealt a heavy body blow in the last couple of months as repeated discounts on the futures didn’t result in a broad market rally.  So, a more neutral or hedged trader would want to try a more balanced approach – less capable of hitting a home run, but with a chance to make money in the two ways shown above.

In the past, the futures have generally proven to be “right.”  That is, $VIX moves to meet the futures (rather than the other way around), and $SPX moves the other way.  Let’s just look at a quick conceptual example:

Example:

Suppose the following prices exist:

$VIX: 31
$VIX front-month futures: 25
$SPX: 1200
(These roughly correspond to prices on 9/15/08)

Scenario 1: If the $VIX futures are “correct,” then $VIX will fall to meet their price, and $SPX should correspondingly rise as $VIX falls. 

Scenario 2: But what if the opposite occurred?  What if $VIX is “correct?”  Then the futures will rise to meet it.  In that case, $VIX might be unchanged, so $SPX might be unchanged as well.

So what strategy would work for these scenarios?  Buying calls on both!  Before explaining why, remember that $VIX options are priced off the futures as their underlying, not off $VIX itself.  We would want to stay in the “front-month” calls because that is where the greatest moves are.

In Scenario 1 above, the $VIX futures remain unchanged, and $SPX rises.  So $VIX calls might lose a little bit of time value premium, but SPY calls would profit nicely on the upward movement of $SPX.

In Scenario 2, $SPX remains relatively unchanged, while $VIX futures rise in price.  Thus SPY calls would lose a little time value premium, while $VIX calls would gain in value since the futures rise in price.

The Opposite Case: At many times earlier this, $VIX futures rose to a premium to $VIX.  That usually signaled a market downturn, but a hedged trader would want to use this $VIX/$SPX strategy in that case. He would buy puts on both $VIX and $SPX.  Again, here’s a short example:

Example:

$VIX: 18
$VIX front-month futures: 22
$SPX: 1400

Scenario 1: the futures are “correct,” so $VIX rises and $SPX falls.

Scenario 2: $VIX is “correct,” so the futures decline to meet $VIX, while $SPX and $VIX remain relatively unchanged.

In both cases, owning puts on both $SPX and the $VIX futures would be a profitable hedge.

How Many Options To Buy?   

The main question we get from readers is how do we determine the proper number of $VIX and SPY calls to buy?  Actually, there is a generic formula for determining a proper hedge when dealing with two different underlying instruments.  This is discussed in detail in the book McMillan On Options, and we have shown it many times in this newsletter as well:

Typically U is 100 shares per contract if stock or index options are involved, but if you are hedging futures options against stock, ETF, or index options, it is something different.

Volatility is typically the 20-day historical volatility, although in extreme times, one may want to take a broader view of volatility.

The Delta of the options is important only if you are, in fact, using options in the trade.  If you are hedging futures against ETF’s, for example, then there is no Delta component.

As a rule of thumb, historically, this formula generally tells one to buy about twice as many $VIX options as SPY options.  However, recent markets are not necessarily “typical,” and so the ratio has been changing.

Let’s use the same two examples from page 2 to determine how we’d set these ratios.  If we are trading $VIX options vs. SPY options, U is equal for both (100), and we’ll make the assumption that we are going to buy options with similar deltas.  Thus, only price and volatility determine the ratio:

That is roughly 5-to-13, meaning we buy 13 $VIX calls and 5 SPY calls.  We didn’t actually establish a spread then, but that ratio was used in our subsequent spreads.

In reality, we did make a recommendation on October 2, 2008, when the discount on the $VIX futures was a whopping 11 points:

That is a 2-to-1 ratio: buy 2 $VIX calls for each SPY call purchased.

Finally, consider the example of 5/22/08:

Again, 2 $VIX puts against 1 SPY put is the proper ratio.

Remember that these ratios need to be adjusted if one buys options with widely different deltas. 

Exiting/Adjusting the Hedge

Once the position is in place, we would want to remove it if $VIX and the front-month futures returned to a “normal” state in which they trade at more or less the same price.  That would be “convergence.”  However, we also know that there is another way to make money in this spread, and that’s if the underlyings move swiftly and sharply in one direction or another.

Consider the spread we actually established as Position I303 on the October 2nd Hotline:

Bought 13 $VIX Oct 32.5 calls @ 3.70
Bought   5 SPY Oct 112 calls @ 5.90

Total debit, including commissions: $7,832 The ratio was altered to 13-to-5 because the $VIX calls were out of the money, while the SPY calls were in the money, as we were (incorrectly) expecting SPY to rise and $VIX to fall.  As it turned out, of course, the market plunged and $VIX skyrocketed.

By October 9th, the following prices existed:

$VIX: 63.92
$VIX Oct futures: 52.29
$VIX Oct 32.5 call: 20.50
SPY: 90.75
SPY Oct 112 call: 0.05

The spread had not converged (there was still over an 11point discount on the Oct futures), but it was very profitable because of the large move that had occurred ($VIX rose, SPY fell).  At this point, it had become a directional trade, and we took a partial profit on 5 of the $VIX calls, setting a trailing stop for the balance.  We eventually sold the balance of the $VIX calls the next week, as the SPY calls expired worthless – a profit of over $30,000 on a relatively small investment.

A much more typical, smaller result was achieved in the position established last May.  See example on page 2.  In that case, the spread did “converge” as $VIX futures rose to meet $VIX and the stock market (SPY) fell.  So, we had a small loss on the $VIX puts and a larger profit on the SPY puts, for a net profit overall of $665 on an original investment of $5,396.

In general, “convergence” will result in relatively small profits, while the second way to profit – volatile moves – will result in much larger profits.  The second scenario is, of course, rarer than the first.

In either scenario, when profits build up, one should take partial profits.  If the futures remain at a significant differential from $VIX, the entire position could be “recentered,” to remove any extreme delta from one side of the position or the other.

What Can Go Wrong?

No strategy is infallible.  In this hedged strategy, the entire debit is at risk if $VIX and SPY “diverge” and yet they don’t make a volatile move.  That is unlikely over a sustained time period, but it can happen in the short term.

For example, on Tuesday October 21st, $VIX futures were at a large (8-point) discount entering the day, so one would be long $VIX calls and SPY calls.  However, that day, $VIX Nov futures fell by 1.05, while SPY also fell by 2.95 – causing losses on both sides of the hedge.  It would be unlikely for that situation to persist, but in theory anything can happen.

Usually, if there are losses on the hedge, the concept of the position is still attractive (i.e., $VIX is still trading at a significant differential to the front-month futures).  Hence, one could “average” down.”

Perhaps more common is the effect of $VIX on the SPY calls.  Suppose one owns calls on both, and $VIX is very high when they are bought.  Then the market rallies and $VIX declines.  The SPY calls that are owned are fighting an uphill battle against a declining $VIX, even as the underlying market is rallying.  This is less likely to be a problem when puts are owned on both, for if the market declines, $VIX rises – thereby helping the SPY puts.  In any case, this effect can be mitigated by buying options that are (deep) in the money, to minimize exposure to volatility (vega) and time decay (theta).

Another potential source for error is in the adjustment process.  If a large delta builds up on one side of the position or the other, one needs to either re-center the position or take partial profits.  Even so, the adjustments may generate losses – especially if the trader imposes a market opinion on the adjustment.

Summary

In summary, this hedged strategy is an excellent way to trade volatility.  That is, the position sets up when the $VIX futures are “predicting” a movement in either volatility and/or the stock market that can be captured with this trade. While it could be traded with $VIX futures, the approach of using options is superior because of the open-endedness of the option position (i.e., its ability to make profits on volatile moves by the underlyings, regardless of whether or not the futures differential converges).

THE SPECIAL OFFER

The Option Strategist Newsletter - 1 Month Free Offer

  • A Newsletter Every Friday:
    The Option Strategist Newsletter is published each Friday, and is generally delivered in the morning.
  • Feature Articles:
    Research articles covering relevant topics, historical studies, and new strategies are published throughout the week and delivered to subscribers immediately.  
  • Specific Trading Recommendations:
    Including follow-up action, trading stops and position analysis. Recommendations are made in the following strategies:
  • Option Buying (puts & calls) based on put-call ratios, speculation, momentum, etc
  • Ratio Spreads, Calendar Spreads, Bull & Bear spreads, Back Spreads, etc
  • Inter-market Spreads
  • Condors / Iron Condors
  • Straddles & Strangles
  • Covered Call Writing & Naked Put Selling
  • Volatility Trading
  • Seasonal Trading
  • and much more
  • Current Market Analysis:
    Larry's weekly stock market analysis based on various technical indicators including put-call ratios, breadth, sentiment, price action, momentum, volatility and volatility derivatives.
  • The Basics
    Review and explanation of key option concepts.
  • Charts, Graphs, & Tables
    Pertinent charts and graphs illustrating important positions, studies, and ideas (put-call ratio signals, price action, support & resistance, term structure, McMillan Oscillator, volatility & variance futures, etc). Tables detailing lists of valuable data ("stocks only" advances & declines, covered call write candidates, volatility skews, expensive and cheap options, implied volatility of $VIX options, etc).
  • Volatility & Variance Futures and Options Update
    In-depth analysis and commentary on the current volatility and variance derivatives markets and what they're saying about the stock market. This important information is found only here.

ABOUT THE AUTHOR


Author: Lawrence McMillan, Founder
Company: McMillan Asset Management
Website: McMillanAsset.com
Services Offered: Trading Education, Account Management Services
Markets Covered: Stocks, Options

Chapter 09

Avi Gilburt | Advice Trade

How Fibonacci Pinball Predicts Market Moves

  • Why sentiment is really what moves the markets
  • How “Fibonacci Pinball” measures market sentiment
  • What’s ahead for Gold and S&P 500 using this method

Chapter
09

How Fibonacci Pinball Predicts Market Moves

By Avi Gilburt, AdviceTrade.com

If you are like most in the market, you probably didn’t expect the market to drop significantly in February and March of this year, nor did you likely expect it to bounce the way it did off the March bottom. You also probably didn’t expect the move up to 3200+ on the S&P 500 (SPX).  Technically – and fundamentally – these moves just didn’t seem possible. 

In fact, if you traded based on news, you would have missed much of the massive 50%+ rally in the market off the March low, as the worst news about COVID came out as we were bottoming in March of 2020.  Moreover, the highest death rates were being reported daily during the rally off the March low. 

But, from an Elliott Wave sentiment-based perspective, the bottom at 2191.86 on the SPX on March 23 was evident in the wave counts, which called for a low-end target of 2187.90, just 4 points below the actual bottom. The local top at 3233.13 on June 8 was just 83 cents from our ideal 3234 target evident on our charts from early April, after which we were expecting a pullback towards the 2900 SPX region.

Similarly, with Gold, you probably didn’t expect the GLD (gold miners ETF) to be approaching the $200 region this year. Yet, when the GLD was at $120, we projected a target of $149.92 by April 2020 (the GLD closed at $149.45 on April 1), and then we expected much higher levels to come later this year, as we approached a long-term target in the $200 region. And, lastly, you likely didn’t expect it if you were listening to the pundits who always told you gold couldn't rally alongside equities!

The Importance of Sentiment

You see, markets are not driven by the substance of news or exogenous events, but are predominantly driven by market sentiment. Many social experiments have been conducted over the last 30 years which proves this to be true, despite the public’s belief to the contrary. And, as these experiments have proven, what does control market direction is something we term “market sentiment” or “social mood.”

In a paper entitled “Large Financial Crashes,” published in 1997 in Physica A., a publication of the European Physical Society, the authors, within their conclusions, present a nice summation for the overall herding phenomena within financial markets:

“Stock markets are fascinating structures with analogies to what is arguably the most complex dynamical system found in natural sciences, i.e., the human mind. Instead of the usual interpretation of the Efficient Market Hypothesis in which traders extract and incorporate consciously (by their action) all information contained in market prices, we propose that the market as a whole can exhibit an “emergent” behavior not shared by any of its constituents. In other words, we have in mind the process of the emergence of intelligent behavior at a macroscopic scale that individuals at the microscopic scales have no idea of. This process has been discussed in biology for instance in the animal populations such as ant colonies or in connection with the emergence of consciousness.”

The prevailing social mood or market sentiment interprets the exogenous events we hear about, and as the market moves based upon the predominant mass sentiment, the media retroactively spins the events to align with the market sentiment. If sentiment is positive, then the market will react positively, even if the news is negative, and vice versa.  This is why we often see markets go up on bad news and down on good news, and it makes so many scratch their heads, especially if they are looking towards “logic” in the markets or if they are looking for their directional cues based upon the substance of the news.  

This also explains why so many were looking the wrong way when the stock market bottomed in March. They were following all the news, pundits and analysis which explained how the market was going to continue to crash. And even as we rallied, if you had read most of the articles being published during the recent 50% rally in the SPX, all you heard was how the market was about to imminently crash again due to unemployment, or bankruptcies, or the 2nd wave of Covid, etc.

But true market sentiment, as measured by our Elliott Wave analysis, was pointing higher, which benefited our members in a life changing way.

Measuring Sentiment Through Mathematical Analysis

How does Elliott Wave analysis measure market sentiment, and what does “Fibonacci Pinball” have to do with any of this?

The answer begins with an understanding of a mathematical principle called “Phi.”

In 1228, Leonardo Fibonacci da Pisa published his monumental work entitled Liber Abaci, in which he “rediscovered” what is commonly known today as the Fibonacci sequence of numbers:  1, 1, 2, 3, 5, 8, 13, 21, 34, 55, 89, 144, etc.  Within this sequence, each higher number is the sum of the prior two numbers, and the ratio of any two consecutive numbers approximates 1.618 or its inverse, .618. The higher you move through the sequence, the closer you move towards the 1.618/.618 relationship. This .618 number has been referred to as the “Golden Mean” throughout history.  We also refer to this number as Phi.

There is significant evidence, based upon recent studies, that behavior and decision making within a herd and on an individual basis display mathematically driven distributions based on Phi. This basically means that mass decision making will move forward and move backward based upon mathematical relationships within their movements.  This is the same mathematical basis with which nature is governed. The same laws that were set in place for nature also govern man’s decision making, en masse, and on an individual basis.

Elliott Wave’s Use of Fibs to Predict Markets

In Elliott Wave analysis, we use ratios based upon Phi, the Fibonacci ratio of 1.618, and its inverse .618, among other ratios, to predict the progression and regression of market prices.

Below is an example of a classic 5-wave market advance.  As you’ll see, each up-wave has 5 sub-waves within it, and each down-wave has 3 sub-waves, with each sub-wave having a specific Phi-derived target.

Once the first two waves (i and ii on the chart) are complete, the sub-waves of the following three waves become relatively easy to prognosticate, as they advance or decline based on Fibonacci extensions that are calculated based on the length of the first two waves.

We call this phenomenon, in which we can more reliably predict the sub-waves starting in the 3rd wave, Fibonacci Pinball.

Essentially, like a caroming pinball, price takes off in a classic 3rd wave, zigzagging in five relatively predictable sub-waves. The relative predictability continues into the 4th and 5th waves.

We used Fibonacci Pinball in predicting the market bottom in March, as well as our upside target in the SPX of over 3200 off that March bottom.

From the top near 3136 that the SPX reached on March 3, labeled wave (2) on the chart, we were able to identify a bottoming target range between 2266.43 and 2187.90, with the lower end nailing the market low.

As you can see on the same chart, we were initially expecting a 4th wave rally, with an upside target of 2725 on the SPX. But once the market moved through that resistance point, it told us quite clearly that we needed to adjust our perspective in favor of a continuing rally north of 3200 from there. 

For those in our chat room, you would know that I noted to our members that I was getting back into the market as we were striking those lows in March, and was even getting back into the market with my children’s 529 plans (since I went to cash in those accounts near the highs and you can only make changes to them twice a year).

On April 11, we posted the following chart. From the trough of the wave (2) low the SPX reached at 2447.49 on April 1, a standard 176.4% extension pointed to 3234.23.  That is exactly (by 87 cents) where the SPX nominally topped on June 8, and, at the time of this writing, we are still unsure if this was the high of all 5 waves off the March lows, or if we are going towards the 3400-3440 SPX region for a more extended initial 5 waves off the March low.

Forecasting Gold

Similar analysis directed our projections on gold.

On May 11, 2019, we wrote the following to our members: “Sideways seems to be the way the metals like to move over the last 3 years.  And, it has become quite maddening.  But, they often say that the bigger the basing, the stronger the rally.  So, when we finally do break out, it would suggest that the market will be moving fast and furious to our targets overhead, as can be seen most clearly in the daily GLD chart I have attached.”


As we showed on the chart, the GLD had actually “bottomed” in a wave 2 in September 2018, and was setting up for what we know in wave 3 to be its most powerful move of the 5 waves. 

That May 2019 chart only shows a portion of the expected upside, pointing to around $150 by April 2020. Here’s what a more recent chart looks like, showing the actual power of that wave 3 move – a move, incidentally, with still more upside ahead for the GLD:

Notice that the top of wave 3 points to a near double in price off the September 2018 wave 2 low near $110.  And looking at a more micro third wave count, a standard 176.4% extension off the wave (ii) low near $156 in June of this year points to the GLD reaching $206 in wave (iii), as shown in the blue box on the chart.

Looking Back To What’s Ahead

Market sentiment is clearly bullish for gold, despite what pundits may tell you about using gold as a hedge against a market downturn. Our Elliott Wave analysis anticipates this positive sentiment will continue to drive the GLD higher, to above the $200 level in the coming months.

From there we should see a major bout of weakness, perhaps at the time when news and pundits tell you all the reasons why you need to own gold. 

To understand how well this methodology has worked in the metals market over the years, consider that I called the market top in gold in 2011 within $6 of the actual high struck that year, and outlined the $1000 region as an ideal target for a correction begun in 2011. This was at a time when everyone and their mother was certain that gold was going to rally through the $2000 mark during the parabolic rally we were experiencing during the summer of 2011. This really highlights the outstandingly accurate topping call we made in 2011.

Then, I told our members the night that gold bottomed in December of 2015 that I was on the phone with my broker buying gold. I was also buying mining stocks quite heavily in 2015. We even rolled out our EWT Mining Stocks Service in September of 2015 in anticipation of a major bottoming in the complex. At the time, we were buying mining stocks such as Barrick Gold in the $7 region, whereas it has more than quadrupled today, just 5 years later.

In fact, Doug Eberhardt, of Buygoldandsilversafely.com, has noted the following about my purchases from him back in 2015:

“I can attest to your accuracy on actually buying both gold and silver from us as close to the bottom as one could. With gold you called it to the letter and your limit order which was placed well in advance executed perfectly. The silver limit orders were within a tight range of the lows as well . . . Your timing on buying the dips is uncanny Avi! People should be aware of this.” 

Then, again, in March of 2020, as silver spiked just below the $12 level, I noted that I was again on the phone with Doug buying silver. Doug posted the following to our members not long after that purchase in March:

“Avi has the magic touch. Listen to him . . . And I want to explain to you all what Avi did for you. He got most of you to buy the metals before the premiums shot up and before everyone ran out of product. This is the 2nd time he has done this and kudos to him for doing that for you.”

In the coming months, I will be outlining to our members where I plan to begin taking profits on the positions I bought in the mining complex back in 2015. 

We also expect a pullback in the SPX in the coming the months, perhaps right when FOMO has everyone and his aunt telling you to buy.

That pullback in the SPX will actually be a primary wave ii, which we see should retrace to a minimum of the 2900 region. Once we determine a bottom for that wave, we’ll be able to measure the Fibonacci extensions that tell us where the next big primary wave iii rally in the market is headed, which could be as high as 5000 in the next few years and with all 5 waves pointing as high as the 6000 region before the start of a multi-year bear market.

THE SPECIAL OFFER

Free 15-Day Trial to ElliotWave Trader

ElliottWaveTrader offers a live Trading Room of market analysis, based on Elliott Wave principle. Founded in 2011 and now featuring 17 analysts serving over 5000 members, the site benefits traders looking to anticipate the direction of U.S. & world equity indices, stocks, bonds, precious metals, cryptocurrencies, energy & forex over a time horizon of several days to several months.

The analysis is led by Avi Gilburt and our team of analysts, including Zac Mannes, Garrett Patten, Mike Golembesky, Carolyn Boroden, Lyn Alden Schwartzer, Ryan Wilday, Ricky Wen, Arkady Yakhnis, Leo Valencia, Princely Mathew, Luke Miller, Dr. Cari Bourette, Larry White, Victor Nguyen, Harry Dunn, and Jason Appel. Their analysis appears frequently on sites such as MarketWatch, TheStreet, Nasdaq, Forbes, and SeekingAlpha.

  •  S&P 500 Wave Analysis
  •  Gold, Silver, Oil & US Dollar Reports
  •  Stocks, Options, Cryptocurrencies & more
  •  Live Coaching & Webinars

ABOUT THE AUTHOR


Author: Avi Gilburt
Company: Advice Trade
Website: AdviceTrade.com
Services Offered: Trading Education, Alerts, Chat rooms
Markets Covered: Stocks, Options, Futures,Forex, Day Trading, Swing Trading, Investing

Chapter 10

Anka Metcalf | Trade Out Loud

Generate a Six Figure Income Trading Futures

  • The advantages of trading futures vs. stocks
  • Reliable blueprint for finding consistent winning trades
  • Simple strategies that generate above average gains

Chapter
10

Generate a Six Figure Income Trading Futures

By Anka Metcalf, TradeOutLoud.com

In this article, I will share why Day Trading Futures is a powerful income source for the astute trader.

I will lay out why I prefer to day trade the Futures markets versus Equities market, and how you can turn a small savings into real wealth with Futures day trading.

Low Start-Up Cost

One of the reasons why many traders are attracted to Day Trading Futures is the minimal start-up cost.

For example: it usually requires approximately $30,000 to open a stock day trading account and you must maintain a minimum of a $25,000 balance in order to keep your day trading status. The Futures market allows you to open an account with a minimum balance of $5,000 and you do not have to maintain that amount. As long as you have sufficient cash in your account to cover the margin requirement to trade the Index or Commodity, you can have a balance of $1,000 and still have the ability to trade Futures.

Leverage 

A significant reason why traders move to trading futures is all about utilizing leverage. Leverage allows a trader to maximize their capital.

For example: An individual trader with a small account is allowed to participate in the Futures market more easily than using a cash account to purchase a stock. A trader will need approximately $5,000 to manage a Futures position that controls an equivalent of a stock position of $80,000.

Leverage can have its advantages as well as its disadvantages. The experienced Futures trader understands the discipline required for a stop loss. A trade should result in only four outcomes: large wins, small wins, break even, small loss.

Tax Advantages

There are numerous advantages to select futures as a trading venue for active traders. One advantage is the possibility of lower effective income tax rates and simplified reporting on your tax return.

Another advantage is Futures contracts fall under the 60/40 rule, where 60% of gains are treated as long-term capital gains and 40% are treated as short-term capital gains (ordinary income) - regardless of the actual length of the holding period.

An additional advantage with trading Futures is the ease of year end filing.   At the end of each year, futures brokers send a futures client a 1099-B form. This tax form reflects the net result of all trading versus each individual trade. This number is entered on the tax return (compared with stock trades where each individual trade must be entered).

A full time futures trader may have tax benefits with trader tax status from the IRS.

Markets open close to 24 hours/day 6 days/week

The Futures market permits it participants to take advantage of price action outside of the New York Session (9:30 AM – 4:00 PM EST).

For example: geopolitical events do not wait for the market to open – events happen…therefore Futures traders can react as these events occur.

Many markets that affect the US stock indexes trade outside US market hours.

Fees and Commissions

Commissions on future trades are very low and are charged when the position is closed. The total brokerage or commission is usually as low as 0.5% of the contract value. However, it depends on the level of service provided by the broker. An online trading commission may be as low as $3.00 per side.

Liquidity

Not all Futures markets are created equal. When it comes to day trading the trader should focus on a market that is liquid. A good example of a liquid market is trading the:

  • E-mini Dow 100,000-300,000 contracts per day
  • E-mini S&P 1-3 million contracts per day
  • E-Mini Nasdaq: 200,000 - 600,000 contracts per day
  • Commodities (Crude Oil approx 800,000 contracts/day
  • Gold approx 300 contracts/day)
  • Bonds (30 Year Treasury Bond) 300,000-600,000 contracts per day

The advantage of the Buying Power

For example: 

If a trader wants to day trade the QQQ  priced at $280.00 the trader needs over $14,000 to buy 100 shares

If the price goes up $0.50 you profit $50.00

Each $0.01 = $1.00

If a trader wants to day trade the E-Mini Nasdaq (/NQ) priced at $11,400 the trader needs $17,000 to buy 1 Contract (BECAUSE OF THE 2020 PANDEMIC VOLATILITY)

If the price goes up 50 points you profit $1,000

Each point = $20.00

We did an experiment to show you the difference between trading stocks and futures is from the buying power and results stan point.

We took 2 trades at the same time based on the same technical pattern and set-ups. 

For this example we used the QQQ (ETF) and /NQ (emini Futures)

Trade Number 1:

QQQ long based on a technical 15 min buy set-up with confirmation.

The trade triggered  at 10 AM EST (Exact timing for reversal)

Buying  power used $14.000

We exited the trade into target with profit

With the $14,000 buying power we enter the trade with 100 shares

Realized profit $73.00

Trade duration: 20 minutes

Trade Number 2:

/NQ  long based on a technical 15 min buy set-up with confirmation.

The trade triggered  at 10 AM EST (Exact timing for reversal)

Buying  power used $17,000

We exited the trade into target with profit

With the $14,000 buying power we enter the trade with 1 contract 

Realized profit $600.00

Trade duration: 20 minutes


The choice is clear

If you had a $20,000 account would you rather trade the QQQ and make $73.00 in 20 min or trade /NQ and make $600.00 in the same amount of time?

THE SPECIAL OFFER

The Power Income FUTURES Day Trading Course

5 DAY LIVE COURSE

Learn To Trade Futures From Experienced FUTURES Traders That Trade the Markets For A Living

  • Live Online Masterclass

  • 30 Day Access To The Trading Room

  • FREE Unlimited LIVE Retakes

  • Access Our Live Courses From Anywhere On Any Device

  • Risk Chart

  • The Power Income FUTURES Day Trading Course
    5 DAY LIVE COURSE

    Learn To Trade Futures From Experienced FUTURES Traders That Trade the Markets For A Living

  • Live Online Masterclass
  • 30 Day Access To The Trading Room
  • FREE Unlimited LIVE Retakes
  • Access Our Live Courses From Anywhere On Any Device
  • Risk Chart
  • On Demand Recordings of All Courses
  • Access to Student Only Specialty Courses
  • Professional Platform Layout

ABOUT THE AUTHOR


Author: Anka Metcalf, Founder
Company: Trade Out Loud
Website: TradeOutLoud.com
Services Offered: Trading Education, Coaching, Futures, Stock and ETF Signals
Markets Covered: Futures, Stocks, ETFs, Day Trading, Swing Trading

Chapter 11

Mark Sebastian | Option Pit

Predicting Market Moves Using Volatility

  • Using volatility to spot the next big sell off
  • Predict short term moves using volatility
  • Integrate volatility to improve long term profits

Chapter
11

Predicting Market Moves Using Volatility

By Mark Sebastian, OptionPit.com

The market collapse of February and March of 2020 and the ensuing rally of April and May has taught us an important lesson…

Volatility when ignored will create utter chaos.  

To those that ignore volatility, there may be months or even years of blissful ignorance.  But eventually volatility will come and it will destroy portfolios. 

Here is the good news…

Paying attention to volatility does not mean gobbling up protection at such a rate that it swallows up returns.  Paying attention to volatility will not only allow the trader to avoid getting crushed when the market explodes, it will allow the trader to actually make MORE dollars on every trade…

through the power of options.

Options are not a leveraging project, they are an insurance product.  But…so is Geico.  Geico is the engine Warren Buffett uses to power Berkshire Hathaway.  While I do not have those types of deep pockets, I do have an understanding of options that will allow ME to show YOU how to use options to produce consistent profits. 

The key is volatility.

There are 3 types of volatility that are measurable in options.  Realized Volatility, Historical Volatility, and Implied Volatility.  While all 3 are important in understanding volatility, the one I want to concentrate on and teach you to use is implied volatility.

Implied volatility is best described as how much risk the market THINKS is in a stock.  Just like Geico insurance charges you a car rate based on how many accidents it THINKS you will get into in a year.

If Geico THINKS you will get into a lot of accidents, your rates will go up.  This can be because of moving to a new city,  because of new drivers in the house that are bad drivers (teenagers), or it could be, that even though it was TOTALLY someone else’s fault, you got into an accident.

On the flip side, if Geico thinks you are a safer driver, your rates will go down.

(I pretty much just explained implied volatility in about 4 sentences, how can this be an entire chapter?)

The answer if only traders got to price out 100 million option trades, it would be.  But they don’t.  At most a retail trader maybe prices out a couple of good trades a DAY. 

Geico can afford to be wrong, pretty often, because they insure A LOT of ‘trades’.  You, as a retail option trader, do not insure lots of trades.  If you are only doing a few transactions,  you cannot afford to be wrong NEARLY as often as an insurance company when buying and selling options (policies).

Thus,  in order to become a profitable options trader you must do every trade with an intent to make real dollars.  Every trade has to have a real advantage to you.  This is WHY you need to know volatility.  This is why you need to understand how to price an option.

Pricing the Option

When you want to buy or sell an option, the first and most important thing to determine is….how expensive are the options.

How do we do that?  It’s pretty simple, we look at a chart.

But not a stock chart.  We look at a volatility chart.  You probably already look at a volatility chart regularly.    How do I know?  Because you probably look at charts of the VIX.

The VIX is an index on volatility of the S&P 500 options.  It measures how expensive options are on the S&P 500.

But the S&P 500 is not the only thing that has an index. 

There are indexes listed by Cboe on close to 100 products.  Everything from FXE (Euro) to GLD (gold) to WTI (oil), there are even volatility indexes in a few individual equities like AAPL.

The beautiful thing about these 100 VIX charts is that they all have one thing in common.  They all mean revert.  This means they hold to an average.

Volatility mean reverts in both the near term and the long term.  In the near term, when volatility has been at the low end of its historical range, it will rise and fall from week to week around a mean.   Let’s take a look at a chart of OVX. 

There is no doubt that oil implied volatility is high.  Even in a short period of time like a month, one can see that IV drops, then pops back, and then drops again.

This happens because volatility has inertia to it.  Things that are not moving tend to say NOT moving and vice versa.  In the chart above, volatility is ‘winding down’ lower after OVX hit an all time high.  But, in this wind down, the inertia pulls the IV back up.

IV, despite having a direction, is still pulling to mean revert. 

Could this be useful to us? 

Of course it can! 

When IV is within a trend or cycle I have a good idea of when I want to buy or sell options.

Let’s take oil for instance.  In the long term, I think Oil will probably be higher than it is currently.  I think most anyone can make that assumption, as the WTI traded below 0, not many other places for it to go.

Now take a look at this chart.  On the top is a candlestick chart of USO.  On the bottom is a chart of IV 30, pretty much the same thing as OVX.  As USO is breaking out, and making a clear move higher, one can also see that IV30 is at a buyable point.

Thus despite the OVX being at 10 year highs, this was a moment where I actually wanted to buy options, not sell.

That is the crazy thing about trading volatility.  Price is relative to where it has been.  Think about it this way.  When AAPL was 260 dollars at the end of November, it did not seem that high, it did not seem ‘expensive.’

When AAPL  was $250 in February, to some, it felt expensive.  This is because we did not know how low it could go.  Near term price is relative.  Thus, when volatility is in a range it becomes tradable.  Actually, much more reliably so than say indicators that one might use on a stock itself.

So how do you trade volatility in the near term? 

The key is to have stocks that you know and follow.  Volatility actually has a feel to it and because it is mean reverting,  unlike many ‘technicals’ that came from a feeling, there is some truth to what you are feeling.

Let’s have a quick example using SLV, pulled directly from my Sharp BETS letter.

We thought SLV was too cheap for a host of reasons.  Then, looking at SLV option volatility (you could look at VXSLV if you don’t use LiveVolPro like I do). 

In early May,  we noticed that SLV IV was at the lowest level we had seen since the crisis, at the same time  SLV itself was near those lows. 

This was an opportunity to strike. 

We bought a call spread buying the 14 calls and selling the 24 calls.  Within a day the spread was up over 30%.  A few days later, we had closed over 75% of the spreads and we’re carrying spreads up about 80%. 

We noticed SLV because of the price.  We made the trade because of the implied volatility, the level of VXSLV.

The point of this is that when volatility is at a near term low,  EVEN if it might seem high, I trade it within the near term trend, NOT what it was months ago, even if I always have my eye on the long term volatility.

Long term volatility is also mean reverting and can help guide you in both near term trading and long term investing.

When I make my presentation in a few weeks I will dig into, in deep detail, how I use long term mean to trade volatility AND to make long term decisions for investing.

For traders and investors, I will walk through my volatility traffic light. 

Using my traffic light I make investing as easy a Red,  Yellow, and Green for my clients.

My readers KNOW if we are red, yellow, or green in the VIX, how they need to be trading the markets for maximum gains!

THE SPECIAL OFFER

Trading Vix Options

Hedging and Trading Strategies

  • Learn All About VIX What Are Vix Options
  • ​Discover How VIX Options Are Not Like Others
  • ​Learn How To Hedge With the VIX
  • ​#1 Secret To Trading VIX Directionally
  • ​Discover What Moves VIX Options

Create Your Free Account by Clicking the button below

ABOUT THE AUTHOR

Author: Mark Sebastian Founder
Company: Option Pit
Website: OptionPit.com
Services Offered: Trading Education, Training, Trade Room, Newsletters
Markets Covered: Stocks, Options

Chapter 12

Vince Vora | Trading Wins

A Simple Technique for Trading Volatile Markets

  • Why simplicity and consistency is the key to success
  • My favorite simple strategy for trading with the trend
  • How simple moving averages can be your best friend

Chapter
12

A Simple Technique for Trading Volatile Markets

By Vince Vora, TradingWins.com

Most traders tend to overthink trades and make their analysis more complicated than it needs to be. They’ll keep adding indicator after indicator, in the hopes of finding the perfect system. Let me tell you, that perfect system does not exist. I know because I used to try to find it too.

In this volatile market, the key is simplicity and consistency. Watching the financial news is NOT a good idea because the talking heads on the networks are not looking out for your best interest. What you need is your own strategy, one that keeps you level-headed when markets are gyrating.

The simple strategy that's featured in this short video is based on the Guppy Multiple Moving Averages. And, it can be used for short-term trading (from 1-5 minutes) to longer investing periods that range from months to years.

In the field of technical analysis, your chances of success increase substantially when you are trading with the trend. Counter-trend trading is best left to traders whose appetite for risk is substantial. The Guppy system will help you quickly identify changing trends with simple moving averages. It's a system that anyone can learn and benefit from. Once you've identified a real trend, you'll see how you can confidently put on simple trades or use options to leverage your position and manage your risk.

THE MOVIE: A SIMPLE TECHNIQUE FOR TRADING VOLATILE MARKETS

THE SPECIAL OFFER

The Magic of Price Action - Pro Training

Learn the full strategy from entry to exit. Specifically designed to trade stocks, options, futures and forex in today's volatile markets.

Here's Everything You Get:

  • 2 surefire techniques to use Trendlines to find powerful trades
  • Powerful ways to identify and trade channels for swing trading
  • A time-tested strategy using only a pencil and ruler to identify incredibly-precise entries and exits
  • 3 Money management techniques to get the most of out this strategy
  • BONUS 1: 'Magic of Ichimoku' training course included for FREE ($197 Value)
  • BONUS 2: TradingWins Pro service included for 30 days ($97 Value)

All for just $3!

ABOUT THE AUTHOR


Author: Vince Vora, Senior Trader
Company: Trading Wins
Website: TradingWins.com
Services Offered: Trade Alerts, Daily Market Commentary, Nightly Videos
Markets Covered: Stocks, options, Forex, Futures

Chapter 13

Serge Berger | The Steady Trader

Best Strategy for Steady Options Income

  • Challenges determining market direction and timing
  • How to quickly and efficiently put odds in your favor
  • High probability trading pattern for steady income

Chapter
13

Best Strategy for Steady Options Income

By Serge Berger, TheSteadyTrader.com

The unprecedented money 'printing' or monetary debasing in recent months on the part of central banks and governments has brought about a market environment in many asset classes from stocks to bonds and currencies to commodities that is much more prone to significant volatility spikes. 

This environment looks to be with us for possibly years to come, much to the detriment of the average market participant, i.e. both traders and investors find it challenging to profitably navigate this market environment.

Thus, many market participants move to derivative markets such as options, where they participate in strategies that are notably riskier than they can anticipate.

But options do not have to be used in a highly speculative way but rather can be used for a steady income strategy that is much more conservative in nature (no, we are not doing buy-writes, i.e. covered calls).

Join Serge's presentation to learn this unique income-oriented options strategy that is used by many of the world's premiere private banks.

VIDEO PRESENTATION: BEST STRATEGY FOR STEADY OPTIONS INCOME

THE SPECIAL OFFER

OPTIONS INCOME SECRETS FROM SERGE BERGER

Options Income Secrets

  • Monthly Options Income Strategy 
  • Low Stress High Probability Cash Flow Strategy
  • Use Options The Way The Pros Do
  • 80% - 90% Winning Trades

TST Vertical X Pro Indicator & Scanner

  • Find dramatically overbought and oversold stocks with the click of a button.
  • HIGH PROBABILITY option credit spread setups
  • Keeps you from buying or selling at the exact worst spot
  • Forces you to be patient, calm and collected
  • Works on: Thinkorswim, TradeStation, NinjaTrader, Tradingview.com, Market Rover

Special BONUS:

  • Bonus eBook: Options Credit Spreads Cheat Sheet

ABOUT THE AUTHOR

Author: Serge Berger, Head Trader and Investment Strategist
Company: The Steady Trader
Website: TheSteadyTrader.com
Services Offered: Trading Education, Trade Alerts, Trading Workshops
Markets Covered: Stocks, Options, Futures
 

Chapter 14

Silas Peters | Seasonal Swing Trader

Price Action Formula for Spotting Reversals

  • A “go-to” chart pattern that works in any market
  • Simple technique that removes emotions from trading
  • How to find clear entry, exit, and risk price points

Chapter
14

Price Action Formula for Spotting Reversals

By Silas Peters, SeasonalSwingtrader.com

In my years of trading I have found that keeping things simple is better. Loading your charts with dozens of indicators can be hazardous to your trading wealth.   We’ve all gone down the shiny-object road that most likely end at the corners of Paralysis and Analysis. 

I want to share a very ‘not-so-secret’ trading strategy and methodology that will probably leave your head scratching as to why you have not (or are not) incorporating this into your daily routine.  I am a strong believer that any so-called ‘strategy’ should work on any markets and on any timeframes if it is truly worth its salt….and this one certainty does.

I encourage you to watch this short video in which I detail this very simple and mechanical setup that appears time and time again, day in and day out whether you trade BAIDU, the British Pound, or Bitcoin...regardless if you analyze the weekly, daily, hourly or tick charts.

Don’t let the simplicity scare you - this is my bread and butter set-and-forget strategy that has been responsible for most of my trading success. Keep things simple and you shall succeed.

SHORT VIDEO PRESENTATION: PRICE ACTION FORMULA FOR SPOTTING REVERSALS

THE SPECIAL OFFER

THE 3S CODE TRADING PROGRAM

  • ​3S CODE INDICATOR + SCANNER:  The #1 chart pattern for trading seasonality with simple seasonal setups. (ThinkorSwim, TradeStation, NinjaTrader 8, TradingView, MT4)
  • WEEKLY HI-LO SWING TRADE IDEAS:  Receive setups each week across the Stocks, Futures and Forex markets - using the proprietary 3S CODE scanner 

YOU WILL ALSO RECEIVE THE FOLLOWING BONUSES:

  • CHART PATTERN PRINCIPLES TRADING COURSE 
  • CHART PATTERN CHEAT SHEET
  • VIP EMAIL SUPPORT
  • 25 TOP OPTIONS STRATEGY GUIDE

ABOUT THE AUTHOR


Author:  Silas Peters
Company:  Seasonal Swing Trader
Website:   SeasonalSwingTrader.com
Services Offered: Trading/Investing education, trade ideas, courses, indicators, scanners, seasonality software
Markets Covered: Stocks, ETFs, Commodities, Futures, Forex


Chapter 15

Andrew Keene | AlphaShark

Supercharged Options Trading System

  • An ex-floor traders unique approach to options trading
  • Using scanners to watch institutional order flow
  • Monitor biggest traders and mimic their positions

Chapter
15

Supercharged Options Trading System

By Andrew Keene, AlphaShark.com

Hi, it's Andrew Keene, and I'm very excited to share my trading methodology at the Trade the Moment Symposium.

During my presentation you will see me trading in ThinkorSwim, coupled with a proprietary scanner which searches for Institutional Order Flow in the options market.

I look for activity from the biggest and best traders in the market, and I mimic their positions. You can view it simply as watching the tape for the best orders and taking those trades.

So, I scan the best trades and feed you the best trade I can find every day.

VIDEO PRESENTATION: SUPERCHARGED OPTIONS TRADING SYSTEM

THE SPECIAL OFFER

SUPERCHARGED OPTIONS SYSTEM

  • One year of trade alerts direct from Andrew Keene (sent via email and SMS) 
  • Trader's Proven Cheat Sheet 
  • 12 Months of Group VIP Mentoring Sessions 
  • 12 months of Direct Email Access with Andrew Keene 

ABOUT THE AUTHOR


Author:  Andrew Keene
Company:  AlphaShark
Website:   www.alphashark.com
Services Offered:   Trading/Investing education, trade ideas, courses, indicators, scanners, traderooms
Markets Covered: Unusual options activity, Stocks, options, futures, forex, cryptocurrencies

Chapter 16

Eric Wilkinson | Pro Trader Strategies

Know When Options Are Cheap and Expensive

  • How volatility can help determine best time to buy options
  • Avoid buying or selling premiums at extreme highs or lows
  • Rules-based method for determining best options strategy

Chapter
16

Know When Options are Cheap and When They're Expensive

By Eric Wilkinson, ProTraderStrategies.com

Understanding options pricing is paramount to the success of any strategy.  This avoids the pitfall of buying premiums when they are at extreme highs or selling options premiums when they are at extreme lows (don't buy high and sell low).  In this video, you will learn about volatility and simple steps that will lead you to when it is the the right time to buy options and where one should sell options to increase ones probabilities of success.

Join Eric "The Wolfman" Wilkinson, former Chicago Board of Trade floor trader and 25 year professional trader, as he explains how traders can use his rules to discern what options strategy is best suited to meet the directional assumption of the trader. Ultimately,  Eric will show a simple way to find the best environment to trade options.

THE MOVIE: KNOW WHEN OPTIONS ARE CHEAP AND WHEN THEY'RE EXPENSIVE

THE SPECIAL OFFER

"Trading Earnings Season Like the Wolfman"

Get the Wolfman Special Options Trading Course by clicking on the button below.

ABOUT THE AUTHOR


Author:  Eric Wilkinson
Company:  Pro Trader Strategies
Website:  https://www.protraderstrategies.com
Services Offered:  Trading Schools and Trading Strategies
Markets Covered:  Futures, Stocks, Forex and Options

Chapter 17

Troy Noonan | BackPackTrader.com

Avoiding the Whipsaw and When to Attack

  • Staying out of the market chop and spotting breakouts
  • Leverage your risk and reward ratio to multiply profits
  • Simple tool for trailing your stop and increase earnings

Chapter
17

Avoiding the Whipsaw and When to Attack

By Troy Noonan, BackPackTrader.com

Hi, this is Troy Noonan. At BackPackTrader.com, we trade to achieve personal freedom. We want to spend less time at the computer, and more time living the llife that we were meant to live.

Let's face it, life isn't easy these days. Covid-19, wearing masks and social distancing is affecting our lives and seriously impacting livelihoods. Tech stocks are reaching astronomical valuations, while oil struggles to break $40

When it comes to trading, you need to be armed to the teeth to achieve consistency. Strategy, money & risk management and trading psychology are essential. Like a 3-legged stool, you need to have all 3 elements to keep the stool from falling over.

VIDEO PRESENTATION: AVOIDING THE WHIPSAW AND WHEN TO ATTACK

THE SPECIAL OFFER

Get the Counter Punch XPPRESS2 System Here!

  • Custom Counter Punch Indicators - Lifetime Access That Work on Major Charting Platforms
  • In-Depth Training Videos
  • Trend Mode Indicator
  • Done For You Trade Plans -  Futures,  Forex,  Equities, and Options
  • 1-Month Access to Live Weekly Crude  Oil Inventory  Report Traderoom Session
  • Ultimate Trade Analyzer 
  • 2 Ebooks: 12 Powers of Successful Trading and No Brainer Guide To Trading Success

ABOUT THE AUTHOR


Author: Troy Noonan
Company: Backpack Trader
Website:  BackPackTrader.com
Services Offered: Trading Education, Alerts
Markets Covered: Stocks, Options, Forex, Day Trading, Swing Trading, Investing

YOUR INVITATIONS

Special Invitation

Roger Scott
WealthPress
From Chapter [1]

The Nasdaq Titan+ Program

  • 24 NASDAQ Titan+ Trade Clusters
  • VIP Trade Room and Profit Academy Video Series
  • Private Members-Only Portal & NASDAQ Titan+ Alert Hotline

Special Invitation

Larry Gaines
PowerCycle Trading
From Chapter [2]

Power Cycle Trading Club

  • Virtual Live Trade Room - Open from 9:25 am to 4:15 pm ET
  • Daily Market Update Videos for Day Traders & Swing Traders
  • Traders Education Vault & Live Weekly Q&A with Larry

Special Invitation

Dr. Barry Burns
Top Dog Trading
From Chapter [3]

FREE Mini-Trading Course

  • Techniques for Staying on the Right Side of the Market
  • How to Find the Best Markets to Trade Right Now
  • Stop Being Stopped Out with Proper Stop Loss Placement

Special Invitation

Gavin Holmes
TradeGuider
From Chapter [4]

How to Become a VSA Trader

  • Learn How to Trade in Harmony with the Smart Money
  • Full Access to the Wyckoff VSA Trading System
  • On-Demand Videos, Articles, eBooks and Courseware

Special Invitation

Geof Smith
Diversified Trading Institute
From Chapter [5]

Ultimate Guide to Being a Profitable Options Trader

  • Discover Geof’s Method of Producing Income with Options
  • How and When to Use DTI’s Famous Horse Race Trade
  • Everything You Need to Become a Profitable Options Trader

Special Invitation

Richard Krugel
Price Action and Income
From Chapter [6]

Plug and Play Profit Signals

  • 2 Weekly Plug and Play Profit Signals
  • 5 Weekly Trade Forecast Reports & Economic News
  • Instant Alerts, Private Telegram, and Member Briefings

Special Invitation

Stephen Bigalow
Candlestick Forum
From Chapter [7]

The Bobble and T-Line Crunch Pattern

  • Learn and Quickly Apply 2 Easy-to-Understand Patterns
  • Works with Your Favorite Indicators and Charting Tools
  • Trade Any Market, Timeframe, and Market Environment

Special Invitation

Larry McMillan
Option Strategist
From Chapter [8]

The Option Strategist Newsletter

  • Receive Your Option Strategist Newsletter Every Friday
  • Featured Articles on a Variety of Relevant Research Topics
  • Specific Trading Recommendations and Position Analysis

Special Invitation

Avi Gilburt
Advice Trade
From Chapter [9]

15-Day Trial of Elliott Wave Trader

  • Live Trading Room Demonstrating Elliott Wave Principles
  • Analysis of Equity, Stock, Bonds, & Commodity Markets
  • Live Coaching, Webinars, and Various Market Reports

Special Invitation

Anka Metcalf
Trade Out Loud
From Chapter [10]

Power Income Futures Day Trading Course

  • Live Online Futures Day Trading Master Class
  • 30-Day Access to the Daily Liev Trading Room
  • On-Demand Access to Video Course Library

Special Invitation

Mark Sebastian
Option Pit
From Chapter [11]

Trading VIX Options

  • Learn About the VIX and Trading VIX Options
  • Discover Why VIX Options Are So Unique
  • Hedging with the VIX and Trading VIX Directionality

Special Invitation

Vince Vora
Trading Wins
From Chapter [12]

The Magic of Price Action

  • 2 Surefire Techniques for Finding Powerful Trades
  • Trade Channels for Improving Swing Trading Results
  • 3 Money Management Methods for Protecting Profits

Special Invitation

Serge Berger
The Steady Trader
From Chapter [13]

Options Income Secrets

  • Complete Access to the Options Income Secrets Course
  • TST Vertical X Pro Indicator and Scanner
  • Bonus Options Credit Spreads eBook and Cheat Sheet

Special Invitation

Silas Peters
Seasonal Swing Trader
From Chapter [14]

The 3S Code Trading Program

  • Complete Access to 3S Code Indicator and Scanner
  • Receive Weekly Hi-Lo Swing Trade Ideas and Setups
  • Bonus access to the Chart Pattern Principles Trading Course

Special Invitation

Andrew Keene
AlphaShark
From Chapter [15]

Supercharged Options Trading System

  • Supercharged Options Trading System Cheat Sheet
  • One Year of Trade Alerts Directly from Andrew Keene
  • 12 Months of Group VIP Mentoring Sessions & Support

Special Invitation

Eric Wilkinson
Pro Trader Strategies
From Chapter [16]

Wolfman’s Special Options Trading Course

  • Complete Introduction to Options and How to Trade Them
  • Learn How Eric Sets Up His Wolfman Options Screens
  • Multiple Low-Risk Strategies for Buying and Selling Options

Special Invitation

Troy Noonan
BackPackTrader.com
From Chapter [17]

Counter Punch XPRESS2 Trading System

  • Lifetime Access to the Custom Counter Punch Indicators
  • Ultimate Trade Analyzer and Trend Mode Indicator
  • On-Demand Training Videos and Multi-Market Trading Plans

January 13th,
11am to 3pm ET