WestmarkTrading - Conquering Uncertainty - Trading and Investing in Volatile Market Conditions

Chapter 1

LIVE PRESENTATION • Wednesday, June 24th 10am ET

Flash Crash, Fast Cash

GUEST EXPERT: Roger Scott | WealthPress

  • How to trade extremely volatile markets
  • How my portfolio is always protected from market crashes
  • Why a systematic approach to trading is best for 99% of traders

A Systematic Way To Make Money, Even When Markets Crash

Markets have been on a wild and volatile ride the past few weeks.

And that’s been a major problem for traders and investors that were used to a mostly drama-free decade where markets moved higher and every dip was a buying opportunity.

Now, we’re seeing daily moves of 7%-plus in individual stocks to the upside and downside regularly. And often, these moves are happening while markets are closed and you can’t do anything about it.

Well, at least most traders think they can’t do anything about it. 

Today I’m going to give you an inside look at how my systems are navigating this market. It doesn’t have to do with timing a trade perfectly, it’s all about having the right stocks and securities in your portfolio and trading them in a disciplined way.

And these systems have proven to work in all markets -- I back-tested them with decades of market data and have been trading them live for years now. 

That includes the extreme volatile market we’re in now, which I expect to last for several months.

Check the chart below of the Volatility Index (VIX) to see what I mean...


The index tracks the 30-day volatility of S&P 500 options. When it’s elevated, as it is now, it means the market expects more volatility, which increases the price of options.

But on a more practical level, it’s a quick visualization of market sentiment. When you see it spike the way it has recently, you can bet there’s market turmoil or uncertainty. 

That’s why the VIX goes by another name, too: The Fear Index.

Most investors hate to see elevated VIX levels. It often means their portfolios are down, and that’s when fear starts to set in and mistakes are made. Let’s just say there’s a strong correlation between the VIX spiking and friends calling me for market advice.

And while markets have rallied off their recent lows, there's still months of bad economic reports and earnings releases coming our way. Not to mention a recession.

This rally won’t continue uninterrupted for the next few weeks, much less the next few months.

So what’s a trader to do? You want to take advantage of the bounces, but don’t want to be left holding the bag when stocks inevitably pull back again. 

A Systematic Way To Make Money (And Protect Your Portfolio)

Markets have a way of pulling the rug out from under investors’ feet when they least expect it. And that’s when you find out “who has been swimming naked,” as Buffett would put it.

And based on some of the emails I’ve received, I know m

any traders have been skinny-dipping in the market. By that I mean trading without a hedge or not using proper risk-management techniques.

This simplest and most effective way I know to protect a portfolio is never being 100% long (or short) or owning assets that are not correlated to the market. 

You can’t predict when markets will fall 6% in two days, so it makes sense to always have something in your portfolio that’s likely to increase in value when markets get crushed.

Hedges might not sound “exciting” -- but what they can do for your portfolio are undeniable. There’s a reason why I build them into most of my trading systems. 

Alpha Trader, for example, is only in four positions at a time. It goes long three sectors ETFs it expects will outperform the market and shorts a sector ETF it expects to lag based on relative strength and other technical factors.

As you can imagine, my long positions were crushed along with everything else when markets collapsed in February.  But the short position more than covered my losses. 

Check it out for yourself:

February 14 - March 2
 

Ticker

Description

Trade

Allocation      

Return

XLK

Technology ETF       

Long        

20%

-72.7%

XLRE

Real Estate ETF

Long

25%

-62.0%

XLU

Utilities ETF

Long

30%

-73.1%

XLE

Energy ETF

Short

25%

455.2%

Total Return     


61.8%

S&P 500


-8.40%


As you can see above, my positions overall were able to deliver a massive 61.8% return over two weeks (that’s how long we hold positions before rotating into new ones).

That was thanks to our hedge, a put option on XLE which jumped 455.2% when stocks and oil prices collapsed. 

Markets continued to crash for the next two weeks, and again the system was profitable. While the S&P 500 fell 19.2% from March 2 through March 17, Alpha Trader delivered an 82% return.   

That’s not the only way to hedge a portfolio, of course. 

Nasdaq Titan, another top-performing system, buys the three blue-chip stocks most likely to outperform over a two week period and hedges the three long positions with a bond ETF. 

Bonds are an example of an asset that usually does the opposite of stocks. That’s especially true when stocks fall. And because I trade options on the bond ETFs hedge, the gains can be significant when markets fall.

From February 14 to March 2, for example, our bond ETF delivered a 341% return. Yes, my long positions took a hit during that time, but my hedge significantly softened the blow.

Best of all, Nasdaq Titan is now taking advantage of the current market bounce. That’s the advantage of using a system with a built-in hedge, it can profit in any market environment.

I hope the examples above help you see why hedges are so important. You might not always need them, but you’ll be glad they’re there when you do. 

Even with the hedges, my systems have proven that they can outperform in bullish markets as well. Having a hedge in place lets you stay in the market with confidence… The last thing you want to do is take a massive hit when stocks crash and sit on the sidelines as markets rally. 

ABOUT THE AUTHOR

Author: Roger Scott, Founder
Company: Wealth Press
Website: WealthPress.com
Services Offered: Trading Courses, Mentorship,
Markets Covered: Stocks, Options, Futures, Forex

WealthPress is widely known for providing traders around the world with the very best in short-term and day trading methodologies.

Chapter 2

LIVE PRESENTATION • Wednesday, June 24th 11am ET

Predicting Market Moves Using Volatility

GUEST EXPERT: Mark Sebastian | Option Pit

  • Using volatility to spot the next big sell off
  • Predict short term moves using volatility
  • Integrate volatility to improve long term profits

The market collapse of February and March of 2020 and the ensuing rally of April and May has taught us an important lesson…

Volatility when ignored will create utter chaos.  

To those that ignore volatility, there may be months or even years of blissful ignorance.  But eventually volatility will come and it will destroy portfolios. 

Here is the good news…

Paying attention to volatility does not mean gobbling up protection at such a rate that it swallows up returns.  Paying attention to volatility will not only allow the trader to avoid getting crushed when the market explodes, it will allow the trader to actually make MORE dollars on every trade…

through the power of options.

Options are not a leveraging project, they are an insurance product.  But…so is Geico.  Geico is the engine Warren Buffett uses to power Berkshire Hathaway.  While I do not have those types of deep pockets, I do have an understanding of options that will allow ME to show YOU how to use options to produce consistent profits. 

The key is volatility.

There are 3 types of volatility that are measurable in options.  Realized Volatility, Historical Volatility, and Implied Volatility.  While all 3 are important in understanding volatility, the one I want to concentrate on and teach you to use is implied volatility.

Implied volatility is best described as how much risk the market THINKS is in a stock.  Just like Geico insurance charges you a car rate based on how many accidents it THINKS you will get into in a year.

If Geico THINKS you will get into a lot of accidents, your rates will go up.  This can be because of moving to a new city,  because of new drivers in the house that are bad drivers (teenagers), or it could be, that even though it was TOTALLY someone else’s fault, you got into an accident.

On the flip side, if Geico thinks you are a safer driver, your rates will go down.

(I pretty much just explained implied volatility in about 4 sentences, how can this be an entire chapter?)

The answer if only traders got to price out 100 million option trades, it would be.  But they don’t.  At most a retail trader maybe prices out a couple of good trades a DAY. 

Geico can afford to be wrong, pretty often, because they insure A LOT of ‘trades’.  You, as a retail option trader, do not insure lots of trades.  If you are only doing a few transactions,  you cannot afford to be wrong NEARLY as often as an insurance company when buying and selling options (policies).

Thus,  in order to become a profitable options trader you must do every trade with an intent to make real dollars.  Every trade has to have a real advantage to you.  This is WHY you need to know volatility.  This is why you need to understand how to price an option.

Pricing the Option

When you want to buy or sell an option, the first and most important thing to determine is….how expensive are the options.

How do we do that?  It’s pretty simple, we look at a chart.

But not a stock chart.  We look at a volatility chart.  You probably already look at a volatility chart regularly.    How do I know?  Because you probably look at charts of the VIX.

The VIX is an index on volatility of the S&P 500 options.  It measures how expensive options are on the S&P 500.

But the S&P 500 is not the only thing that has an index. 

There are indexes listed by Cboe on close to 100 products.  Everything from FXE (Euro) to GLD (gold) to WTI (oil), there are even volatility indexes in a few individual equities like AAPL.

The beautiful thing about these 100 VIX charts is that they all have one thing in common.  They all mean revert.  This means they hold to an average.

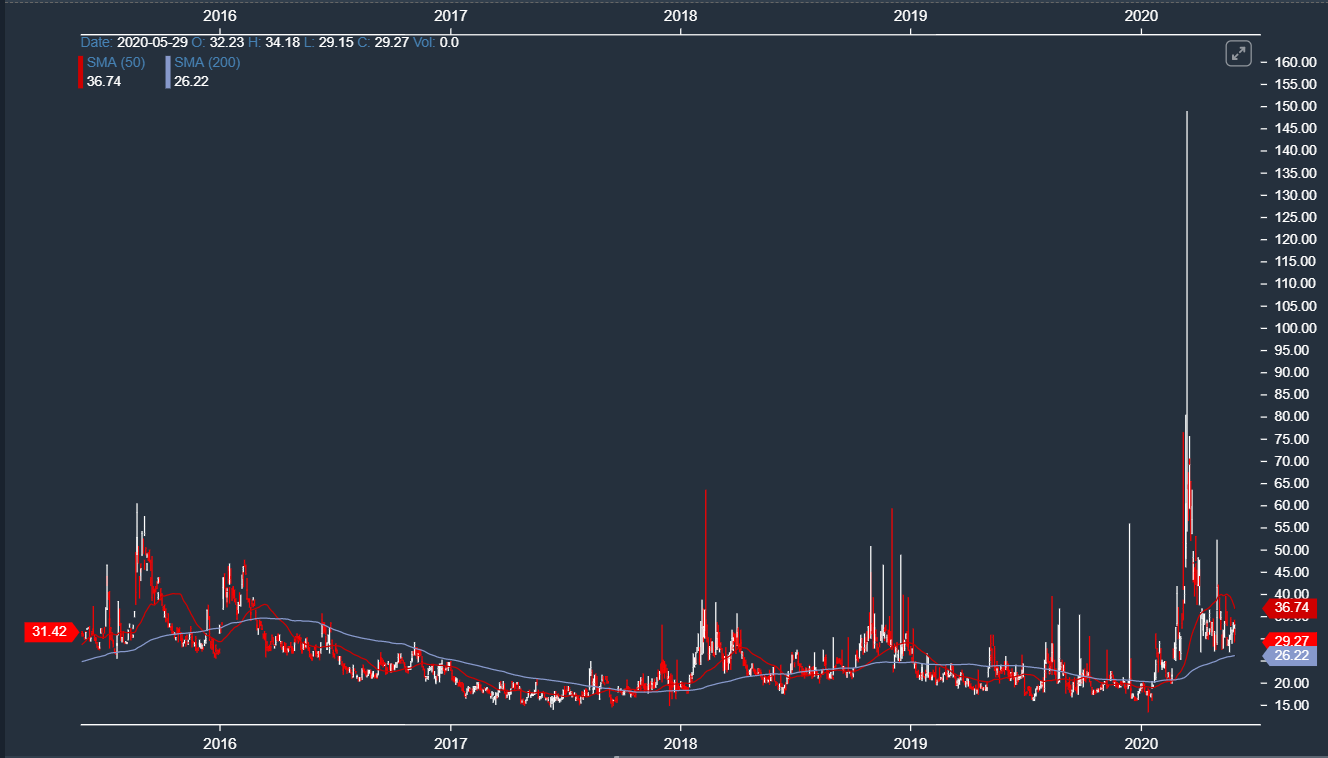
Volatility mean reverts in both the near term and the long term.  In the near term, when volatility has been at the low end of its historical range, it will rise and fall from week to week around a mean.   Let’s take a look at a chart of OVX. 

There is no doubt that oil implied volatility is high.  Even in a short period of time like a month, one can see that IV drops, then pops back, and then drops again.

This happens because volatility has inertia to it.  Things that are not moving tend to say NOT moving and vice versa.  In the chart above, volatility is ‘winding down’ lower after OVX hit an all time high.  But, in this wind down, the inertia pulls the IV back up.

IV, despite having a direction, is still pulling to mean revert. 

Could this be useful to us? 

Of course it can! 

When IV is within a trend or cycle I have a good idea of when I want to buy or sell options.

Let’s take oil for instance.  In the long term, I think Oil will probably be higher than it is currently.  I think most anyone can make that assumption, as the WTI traded below 0, not many other places for it to go.

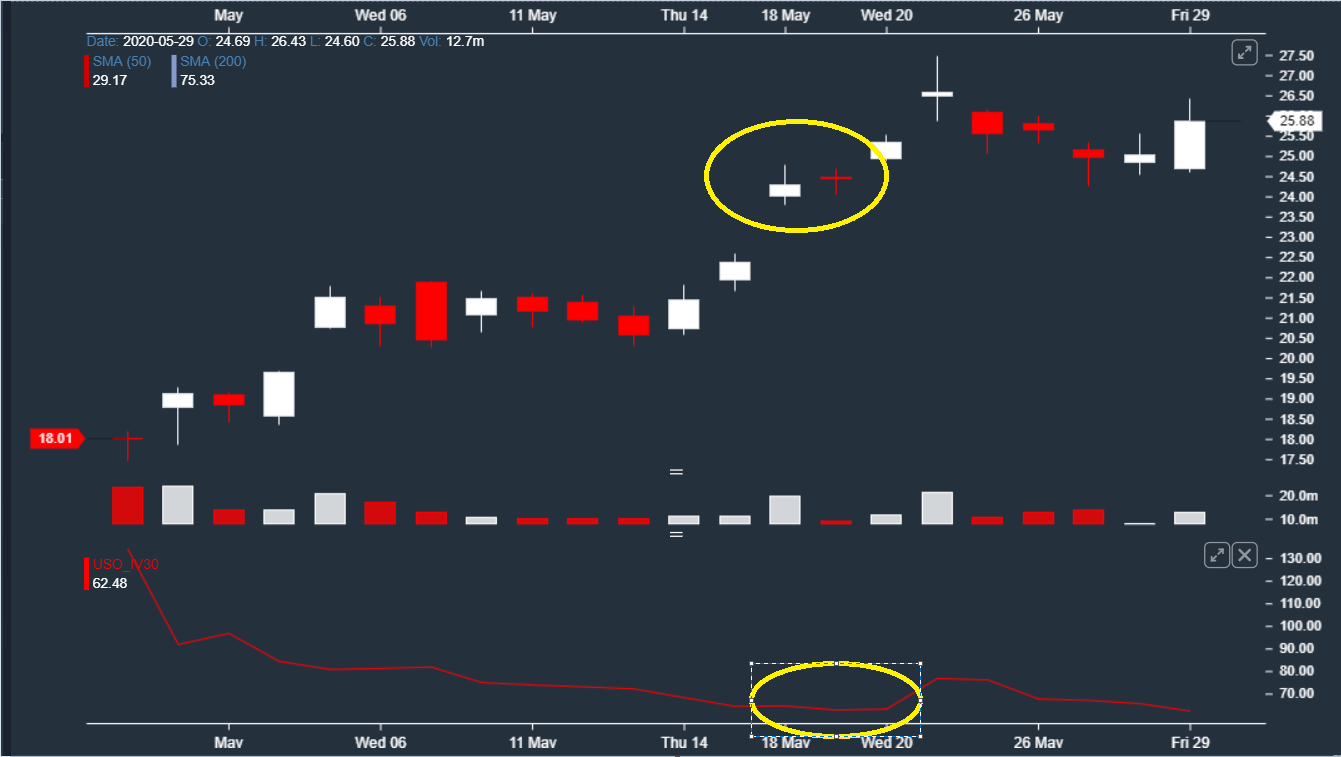
Now take a look at this chart.  On the top is a candlestick chart of USO.  On the bottom is a chart of IV 30, pretty much the same thing as OVX.  As USO is breaking out, and making a clear move higher, one can also see that IV30 is at a buyable point.

Thus despite the OVX being at 10 year highs, this was a moment where I actually wanted to buy options, not sell.

That is the crazy thing about trading volatility.  Price is relative to where it has been.  Think about it this way.  When AAPL was 260 dollars at the end of November, it did not seem that high, it did not seem ‘expensive.’

When AAPL  was $250 in February, to some, it felt expensive.  This is because we did not know how low it could go.  Near term price is relative.  Thus, when volatility is in a range it becomes tradable.  Actually, much more reliably so than say indicators that one might use on a stock itself.

So how do you trade volatility in the near term? 

The key is to have stocks that you know and follow.  Volatility actually has a feel to it and because it is mean reverting,  unlike many ‘technicals’ that came from a feeling, there is some truth to what you are feeling.

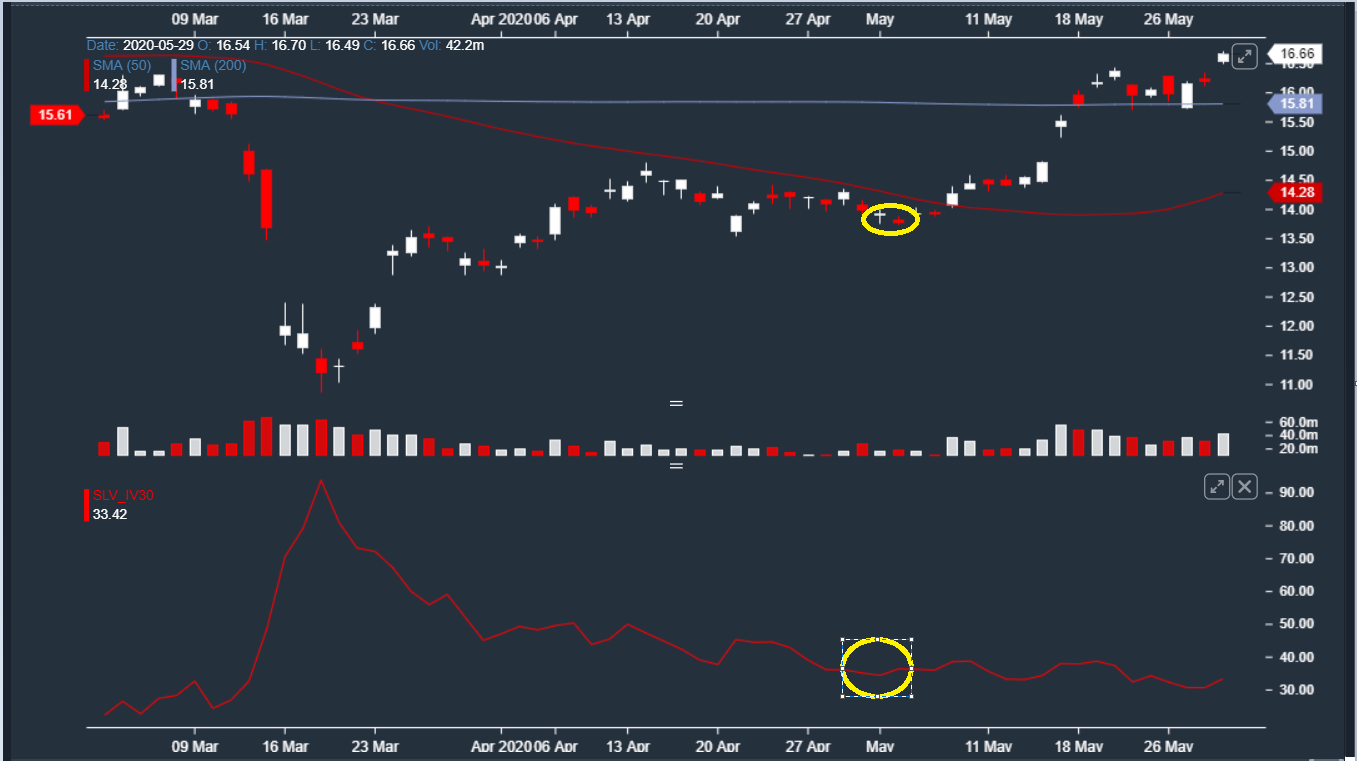
Let’s have a quick example using SLV, pulled directly from my Sharp BETS letter.

We thought SLV was too cheap for a host of reasons.  Then, looking at SLV option volatility (you could look at VXSLV if you don’t use LiveVolPro like I do). 

In early May,  we noticed that SLV IV was at the lowest level we had seen since the crisis, at the same time  SLV itself was near those lows. 

This was an opportunity to strike. 

We bought a call spread buying the 14 calls and selling the 24 calls.  Within a day the spread was up over 30%.  A few days later, we had closed over 75% of the spreads and we’re carrying spreads up about 80%. 

We noticed SLV because of the price.  We made the trade because of the implied volatility, the level of VXSLV.

The point of this is that when volatility is at a near term low,  EVEN if it might seem high, I trade it within the near term trend, NOT what it was months ago, even if I always have my eye on the long term volatility.

Long term volatility is also mean reverting and can help guide you in both near term trading and long term investing.

When I make my presentation in a few weeks I will dig into, in deep detail, how I use long term mean to trade volatility AND to make long term decisions for investing.

For traders and investors, I will walk through my volatility traffic light. 

Using my traffic light I make investing as easy a Red,  Yellow, and Green for my clients.

My readers KNOW if we are red, yellow, or green in the VIX, how they need to be trading the markets for maximum gains!

Your Only Option

Mark

P.S. - I can't wait to see you soon at our live event and pull back the curtains on my proprietary indicators that allow everyday traders just like you capture quick gains in the market like I did as a real market maker.

ABOUT THE AUTHOR

Author: Mark Sebastian Founder
Company: Option Pit
Website: OptionPit.com
Services Offered: Trading Education, Training, Trade Room, Newsletters
Markets Covered: Stocks, Options

Mark Sebastian is a former member of both the Chicago Board Options Exchange and the American Stock Exchange. The Author of the popular trading manual "The Option Traders Hedge fund."  He is a frequent guest on CNBC, Fox Business News, Bloomberg, First Business News.

Chapter 3

LIVE PRESENTATION • Wednesday, June 24th 12pm ET

Trading and Investing in Volatile Markets

GUEST EXPERT: Melissa Armo | Stock Swoosh

  • What’s driving current market volatility
  • Best index for gauging market direction
  • Gap opportunities with selective stocks

Trading and investing are two completely different things.

Investing is when you are in a stock for weeks, months or years (preferably years). Trading is active. You're chunking it out every day. You're taking money in and out of the markets in a matter of seconds, hours or days.

If you're investing, you want to look at fundamentals as well as technicals. If you're trading then technicals are front and center.

In this video, you will learn:

  • What’s driving current market volatility

  • Best index for gauging market direction

  • Gap opportunities with selective stocks 

THE MOVIE: TRADING AND INVESTING IN VOLATILE MARKETS

ABOUT THE AUTHOR

Author: Melissa Armo, Founder
Company: The Stock Swoosh
Website: TheStockSwoosh.com
Services Offered: Trading Rooms, Trading Courses, Newsletters
Markets Covered: Stocks, Options

Melissa developed a system that capitalizes on the big moves that happen near the open of the market every day. She has an international business that informs her clients how to trade successfully utilizing her system.

Chapter 4

LIVE PRESENTATION • Wednesday, June 24th 1pm ET

3-Step Playbook for Making Consistent Profits

GUEST EXPERT: Jody Samuels | FX Traders Edge

  • Analysis framework for finding best markets
  • Entry setup checklist for trading any timeframe
  • Proper position sizing, profit target and stop settings

INTRODUCTION

Welcome to this 3-STEP PLAYBOOK to help remove trading and investing uncertainty during this unique and volatile trading period.  If you are just starting your trading business or have been trading for several years, you will probably agree that having a roadmap to navigate the markets is the prudent course to take. My trading career began on Wall Street in the early 80’s and it is no surprise that I have traded through many different and challenging trading environments. The one constant is that no two trading days are the same. However, I do recommend learning a logical approach to better equip oneself to feel more comfortable trading and investing during any type of market cycle.

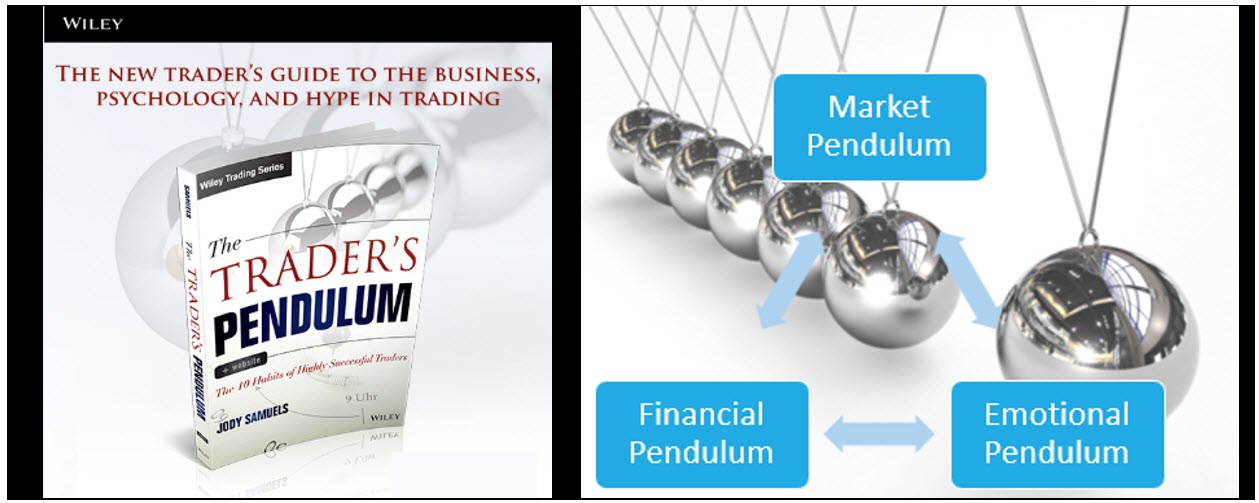
In my book, The Trader’s Pendulum, I describe how all traders trade the market, financial and emotional pendulums every trading day. Unsuccessful traders ride the pendulum back and forth with no real idea of the pendulum’s swing. Successful traders recognize that the pendulum swings and ride it mindfully – as a result, they make better decisions and better trades. The lack of skills to weather the swings is what makes trading an emotional – psychological roller coaster ride for traders.

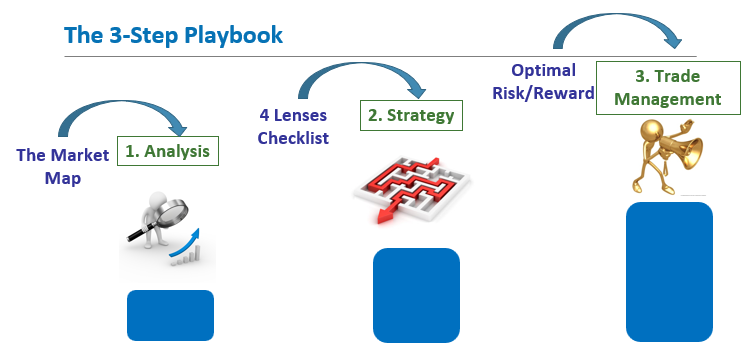
The 3-Step Playbook that we are going to learn today will help us trade the market, financial and emotional pendulums mindfully. This Playbook provides the foundation and roadmap to navigate the markets during uncertain times and can be broken down as follows:

  1. Learn to anticipate market direction by reading the “Market Map” – to have a sense where the market is going before placing a trade.
  2. Master the 4 Lenses Checklist, which is the strategy that I use to identify and filter the markets to find one of our Wavy Tunnel PRO setups – to locate and trade high probability setups with confidence.
  3. The final step is to trade only the most highly lucrative setups for maximum profits by using well defined risk and trade management.

PRESENTING THE 3-STEP PLAYBOOK

1. ANALYSIS: THE MARKET MAP

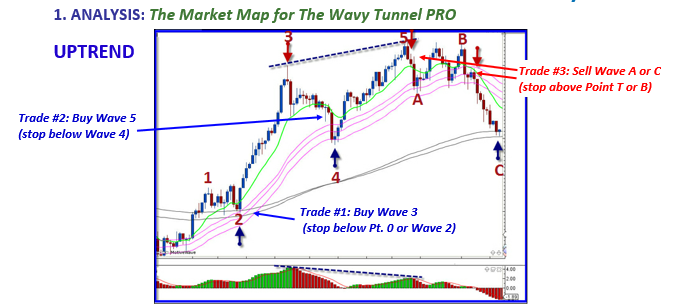
The first step in achieving consistency is to have a thorough knowledge of the market to determine possible future scenarios and be prepared to take advantage of opportunities that arise. In our system we use the Market Map to provide market context and increase the likelihood of successful outcomes. The Market Map is the 8-wave market cycle, for uptrends and downtrends. There are ideal setups for every part of the cycle and how you trade Wave 3 for example, is not the same way you would trade a Wave 4 for anticipating the Wave 5 move. The key ingredient is to know the direction of the primary trend and when that trend is about to end. In the diagram below, the potential trades are highlighted with blue and red arrows for buying and selling.

To put it into perspective, the ideal market map on a candlestick chart below identifies the 3 trades to take during different parts of the cycle. These patterns can be found on any instrument, in any asset class, and on any time frame.

2. STRATEGY: THE 4 LENSES CHECKLIST FOR PULLING THE TRIGGER

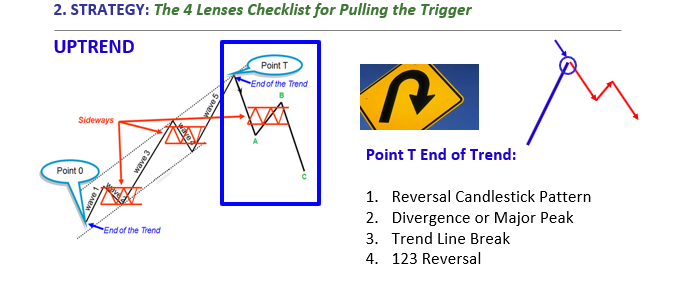
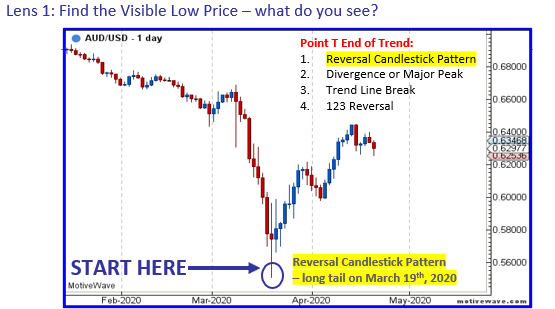
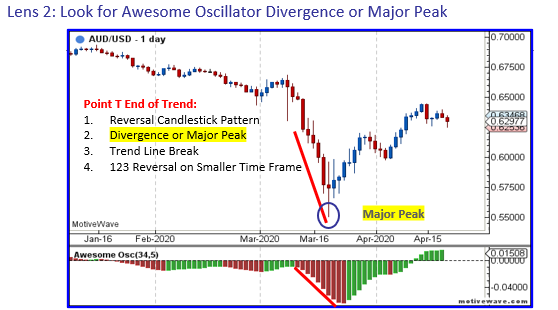
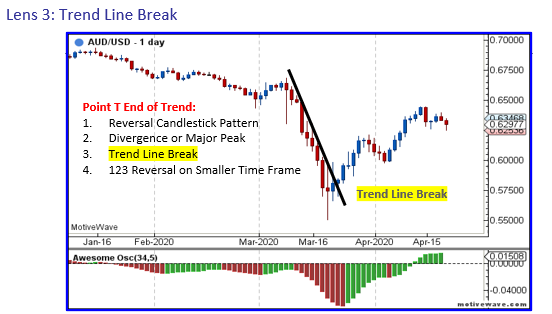
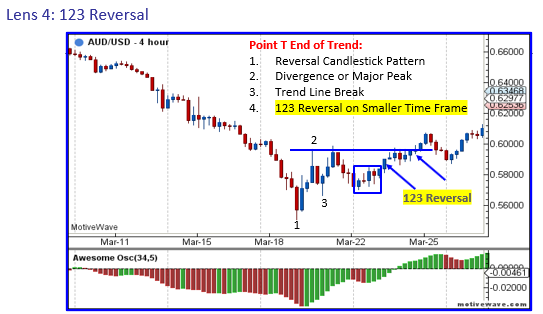
The second step in my Playbook is to have a highly effective strategy which is easy to understand when making a trading decision. After a good analysis, strategy is used to identify the exact entry point, stop loss level, and profit target, to know when to trade and when to stay out of the market. Removing the emotions is key. The 4 Lenses Checklist is a simple strategy used to identify the end of the trend with confirmations. Very often traders “pull the trigger” too soon, only to see themselves whipsawed in the markets, which is why it is important to have numerous confirmations saying the same thing, in the form of a checklist. The following chart lists the checklist for the Point T End of Trend trade in an uptrend. This also applies to downtrends.

I follow extremely specific criteria in my 4 Lenses Strategy, to evaluate if I want to trade a specific setup as illustrated below. I remove subjectivity with the specific criteria. The greater the objectivity, the fewer the emotions!

THE 4 LENSES CHECKLIST EXAMPLE:

3. TRADE MANAGEMENT: OPTIMAL RISK/REWARD FOR ACHIEVING CONSISTENT PROFITS

The third step in my Playbook is Trade Management. The idea is to apply optimal Risk and Money Management overlaid with a Trade Management methodology to maximize profits. This step can tip the balance between being profitable or not. For example, by trading only setups with a minimum risk/reward ratio you set in advance (i.e. 1.5:1), you can refine your analysis and improve your performance stats immensely. Trade management is part of the equation because with a plan to identify profit targets, using multiple positions, you can take profits along the way and keep part of the position as the trade moves in your favor. Consequently, you need a smaller win/loss ratio when you have a plan to ride the position longer than you normally would!

CONCLUSION

The 3-Step Playbook that we just learned will help you trade any instrument, asset class or time frame mindfully. This Playbook provides the foundation and roadmap to navigate the markets during uncertain times and can be summarized into the following steps:

1. Read the Market Map (analysis);

2. Go through the 4 Lenses Checklist (strategy); and

3. Use well defined risk and trade management.

I hope you enjoyed this framework. Good luck in your trading business!

ABOUT THE AUTHOR

Author: Jody Samuels, Founder
Company: The FX Trader’s Edge
Website: fxTradersEdge.com
Services Offered: Trading Courses, Live Trading Room, Daily Trade Videos
Markets Covered: Stocks, ETFs, Emini Futures, Forex, Day Trading

Jody Samuels is one of North America’s leading coaches for successful traders, and the creator of The FX Trader’s EDGE™ Program. She works with members of her program in group and private coaching sessions and is passionate about teaching individuals how to trade the market cycles and use entrepreneurial skills and habits to effectively manage their business.​

Chapter 5

LIVE PRESENTATION • Wednesday, June 24th 2pm ET

Selling Credit Spreads in Volatile Markets

GUEST EXPERT: Peter Schultz | Cashflow Heaven

  • Why selling credit spreads is a smart high-odds strategy
  • 3 strategy rules for consistently leveraging time decay
  • When to close your position to protect your profits

See how to collect big profits from a low-volatility strategy—even in crazy volatile markets

Selling credit spreads is a smart high-odds strategy because you have the biggest, most consistent characteristic of options working for you—time decay. That’s why most professional options traders and anyone who has been around for awhile uses this strategy for the majority of their options trades—because the odds tell us this strategy will work in your favor the majority of the time.

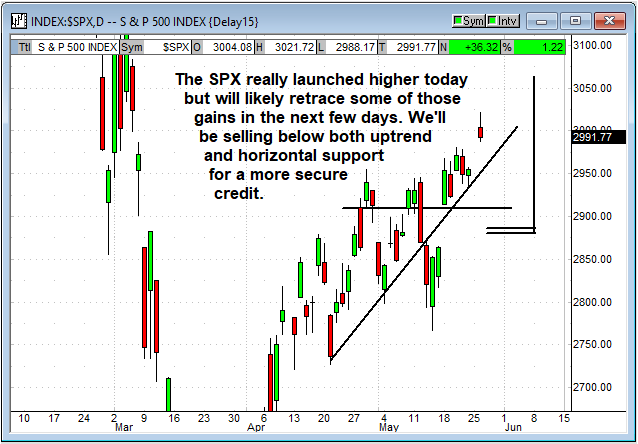
This chart is typical of our recommendations and shows why you have such an overwhelming chance of winning.

As it turned out the SPX retraced a little and we did get filled at a very nice credit. But take a look at that chart and where the spread was placed. If the SPX closes anywhere above our spread, it expires at a full profit. Keep in mind the SPX is heading higher—and has fairly consistent uptrend support—plus we’re selling below even much lower horizontal support. So, the first rule of this strategy stays consistent in any kind of market:

Strategy Rule #1: Sell your spreads where you think the stock is unlikely to go.

That’s the main reason you have such a great chance of winning--because the index would have to do something really crazy for you to lose. All other things considered, you’ll win on this trade—and the options statistics consistently tell us that.

Remember when buying straight puts and calls you need to be almost perfect on both direction and timing to make money. If the direction is right but the stock takes a little longer than you thought to move your way, then the option can expire for a big loss.

But it’s just the opposite when you are selling options. If the SPX spikes higher you win—if it goes up just a little bit you win—if it goes sideways you win, and even if it goes down a little bit—you still win.

So that’s why we sell out of the money credit spreads--and it’s why you should as well.

But What Happens if the Market Goes Crazy—Isn’t this the LAST Strategy You Would Want in a Volatile Market?

That’s the common wisdom—most traders will tell say you would have to be crazy to sell credit spreads in a volatile market. But in this short presentation you are going to see some surprisingly compelling reasons to do exactly that.

Why? Don’t volatile markets induce huge risk in selling spreads?

Yes, they do—but if you know how options are priced you can take advantage of that volatility premium to make even bigger profits with less risk.

Here’s why—when you sell a credit spread you are selling options that are entirely time value—there is no intrinsic value because the option out-of-the-money.

So the key is how the market assigns value to the time portion of the option.

That value has a lot to do with expectations. And expectations have a lot to do with what happened with the underlying in the recent past.

For example, if a stock or index just made a big move—or just reported earnings—or just whipsawed in both directions—exactly the kind of thing that happens in volatile markets—the implied volatility goes through the roof.

But here is what is interesting—crazy wild swings don’t last--they are typically followed by periods of calm.  

And that creates opportunity because the time value of an option can become very expensive because the stock just jumped this way or that—and often that value stays with the option even as the stock starts to calm down.

Which is why one of the best times to sell an options spread is the day AFTER a stock announces earnings—because the options premium is often still elevated—and yet the stock is already settling down.

One of the easiest ways to see this behavior is with Bollinger Bands.

When the stock trades in a fairly narrow range for a while the bands narrow—but when there is an explosion one way or the other the bands get very wide. When those bands are wide is the when the time value of the options are at an extreme high—and it’s often the perfect time to sell.

The reason is—as you can see from the chart—explosive moves don’t last. They are almost always followed by periods of calm, and when the stock starts to settle down into a sideways move all that volatility premium rapidly dissipates.

Strategy Rule #2: In addition to our first rule of selling options where we think the stock isn’t going to go, we’ve now got a second rule which is especially true for selling options in volatile markets. And that is to sell AFTER an explosive move. The premiums are much higher than normal, and they will dissipate quickly the moment the stock starts to settle down.

Wouldn’t it be nice to see at a glance whether options premiums are expensive or cheap?

Yes—that would make this strategy much easier, and fortunately, there is a way.

Many options trading programs and brokers now show statistics for historic versus implied volatility. Historic volatility is what the range of movement has been over a long period of time. Implied volatility is what the volatility is right now.

The key when selling options to take advantage of inflated pricing is to sell when the implied volatility is HIGHER than the historical volatility. That tells us at a glance that the time value of the options is high—and that it has a good chance of settling lower in the immediate future.

So where do we find that information? We generally recommend the thinkorswim platform for options because they have really great trading tools, have the ability to get you filled inside the spread, and are competitive on their fees.

Any good options trading platform should be able to provide this information but on the thinkorswim platform you go to the trade tab and enter whatever underlying you are interested in—either a stock or an index--and at that point all the different expiration dates will populate under your ticker.

Scroll to the bottom of all those different dates and you’ll see a drop-down arrow that says, ‘Today’s Options Statistics’. Click that drop-down arrow and you’ll see all kinds of options numbers but what you are looking for is the current Historic Volatility (HV) percentage versus the Implied Volatility.

If the implied volatility is higher than the historic volatility—like what you see above--then you know the time portion of the option is particularly expensive and is probably worth selling.

And the opposite is true as well—if the implied volatility is lower than the historic volatility then the time portion of the option is cheap and probably not worth selling.

Here’s what is interesting about the time value of an option—everyone thinks the value is based on the time remaining until expiration—but it’s really based on the implied volatility of the underlying.

Let me give you an example; let’s say you sell an option with 10 days of time left on it and the time value is 3 dollars—which means there is 30 cents worth of value for that option per day. And your goal when you sell is to let enough time decay to go by to realize 70% of that value and then you’ll close the position. So naturally you figure you’ll have to hang on for 7 days to capture 70% of the 10 days of time value.

But what actually happens was after you sold the option the stock stabilizes and the volatility premium on that underlying collapses so that all of a sudden you’ve realized 70% of that 3 dollar premium in just 4 days. It’s kind of like time got compressed. You thought going in you’d have to hold on to the position for 7 days, but you really just have to hold on for 4.

That’s a huge win because it allows make another important move toward stacking the deck in your favor when selling options in volatile markets---

Strategy Rule #3: Make your money and get out as soon as possible to limit your risk.

And volatility collapse lets you do that.

You see the more time you spend holding a position in a volatile market the more chance there is of something bad happening. So selling high volatility and closing at low volatility allows you to realize your profit goal more quickly. Something that’s especially true if you have no idea where this crazy stock or index is liable to jump next.

Here is a great example of volatility collapse:

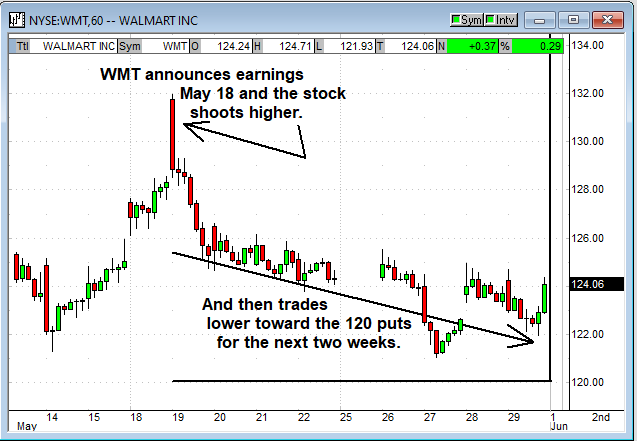
Walmart shot higher and reversed sharply after their earnings announcement on May 18 and that volatility spike rocketed the May 29 expiration 120 put value straight up.

And then right after that the stock declined trading consistently toward the 120 strike—so what happened to its value?

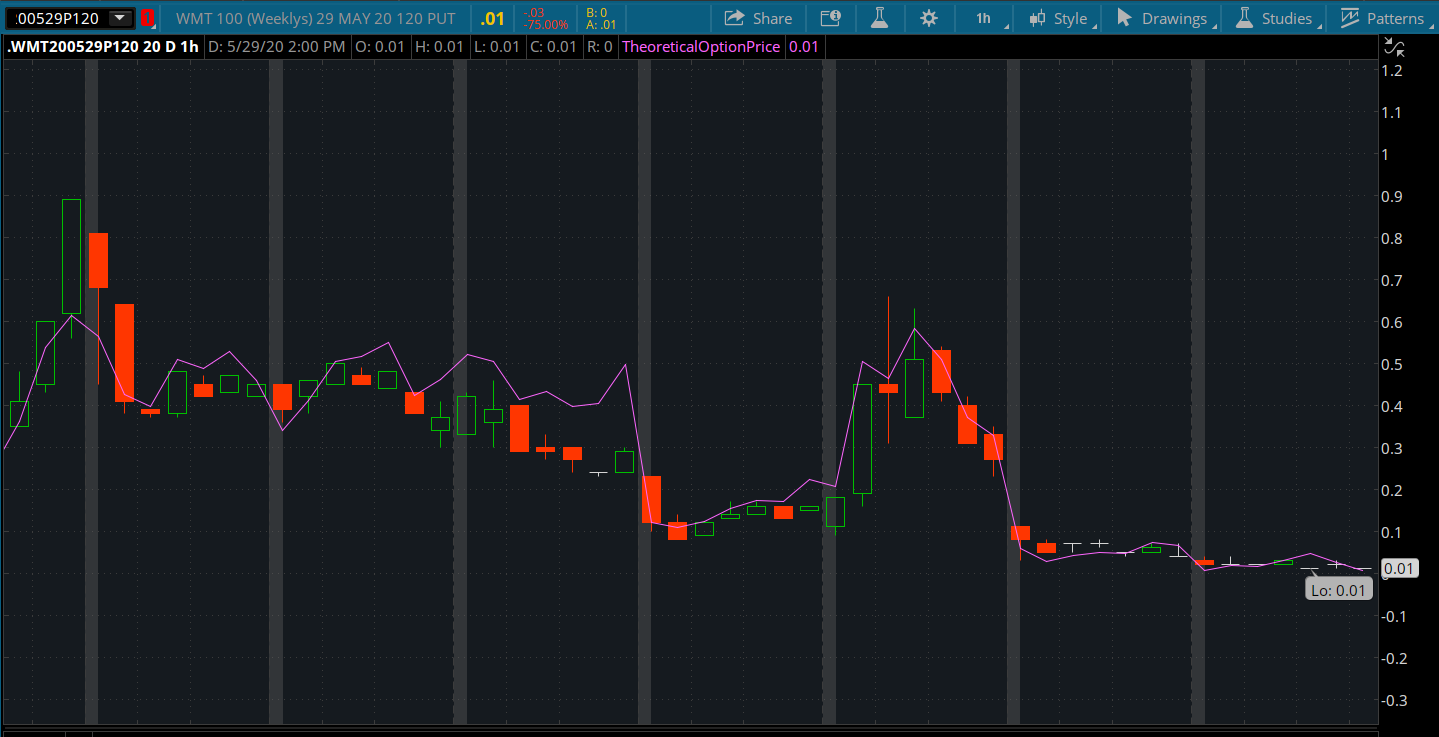
One of the standard beliefs we all hold about option is that the value of calls goes up when the stock goes up and the value of puts goes up when the stock goes down. But look at the chart above showing the value of the WMT May 29 puts in the seven days before expiration. The stock steadily traded TOWARD the put strike as you can see from the Walmart (WMT) chart, and yet the puts kept dropping in value until they hit zero at expiration.

Part of that drop in value is time decay—and that was really evident in the last two days—but what is wild for options traders is to see the stock heading toward the strike and STILL have the value drop so dramatically. That’s the exact opposite of what you’d expect and is almost entirely due to volatility collapse.

The conclusion is that selling credit spreads—or selling options premium in general—in times of inflated volatility is actually the PERFECT time to sell because the time value dissipates so quickly once the stock starts to settle down.

So, in conclusion there are 3 basic rules for selling options in volatile markets that can REALLY stack the deck in your favor:

Strategy Rule #1: Sell your spreads where the stock isn’t likely to go.
This is the most basic fundamental rule of spread selling and it’s what makes this strategy so high-odds to begin with—all other things being equal—you win. The key is selling in the opposite direction of the trend and selling put spreads below support and call spreads above resistance.

Strategy Rule #2: Sell inflated volatility options to capture inflated premium that is likely to dissipate quickly, making you money with volatility collapse—in some cases even if the underlying goes toward your sold strike.

As we’ve seen this is a HUGE key to success—because you bring in more premium in the first place, and it tends to dissipate quickly—which allows you take advantage of rule number 3.

Strategy Rule #3: Make your money quickly and close the position once you’ve realized the majority of your gains—and volatility collapse allows you to do that.

This is one of biggest keys to trading in volatile markets—once you’ve made the majority of the potential profit on a trade—say 70% or more---close the position. The moment you do that you’ve removed any remaining risk exposure which is especially important when trading unpredictable markets that could potentially turn a winning position into a loser with one big gap higher or lower.

Follow these 3 simple rules and you might be surprised how profitable—and enjoyable--volatile markets can be.

ABOUT THE AUTHOR

Author: Peter Schultz, Founder
Company: Cashflow Heaven Publishing
Website: CashflowHeavenPublishing.com
Services Offered: Trading Courses, Coaching, Weekly Advisory Newsletter
Markets Covered: Stocks, Options

Peter has been showing self-directed investors how to trade successfully since 1996, and is a nationally known speaker on options trading, the author of Passage to Freedom, The Options Success Trading Package, The Winning Secret Trading Package, The Explosive Profits Package and The Greatest Options Strategies on Earth.

Chapter 6

LIVE PRESENTATION • Wednesday, June 24th 3pm ET

Micro and Mini Futures - The Next Big Thing

GUEST EXPERT: Todd “Bubba” Horwitz | Bubba Trading

  • An algorithmic trading platform for all types of traders
  • How to take simultaneous advantage of market ups and downs
  • Using diversification for building confidence and consistency

The major reason traders lose money in the long run is because they miss trades, let losses run in the trades they are in, and take profits far too early on the winners. My method does none of the three and therefore our odds of winning are greatly enhanced and proven by real-time performance. We cannot miss a major move in any market, we do not let losses run and we always let profits run. That is because the algorithm was designed to do exactly those three things.

Like a classic E-mini contract, a Micro E-mini contract also provides exposure to major market indices, but at 1/10 the size and a lower margin requirement:

• Get 24/6 access to the most liquid stock market indices.

• Add flexibility in changing market conditions through more precise long or short exposure.

• Help reduce market risk without making changes to your equity portfolio.

As with all futures products, Micro E-mini contracts are leveraged products that can result in losses exceeding the original investment. It is important to understand the terms and risks involved with futures products before placing a futures trade.

I contend that no one knows as to why markets do anything and hence it is impossible to "predict" future prices with any consistency or accuracy. Those that think they can "forecast" are fools and will soon find themselves broke. Gurus con gullible traders into believing they have some special knowledge of the future. Unfortunately, 99% of all trading is based on false premises, and this is why so very few obtain large wealth from the trading game. If you want to make money trading, you simply buy when prices are going up and sell when they are going down. It is that simple and basic, but this concept evades most traders because they think they will make more if they know more. I contend it is the opposite: the less you know the more you will make.

THE MOVIE: MICRO AND MINI FUTURES - THE NEXT GREATEST THING

ABOUT THE AUTHOR

Author: Todd "Bubba" Horwitz
Company: The Bubba Show
Websites: TheBubbaShow.orgBubbaTrading.com
Services Offered: Market Commentary, Trade Alerts
Markets Covered: Futures, Stocks, Options

Todd Horwitz -- known as Bubba -- is chief market strategist of BubbaTrading.com. He is a regular contributor on Fox, CNBC, BNN, Kitco, and Bloomberg.

Chapter 7

LIVE PRESENTATION • Wednesday, June 24th 4pm ET

An Option Strategy for Uncertain Markets

GUEST EXPERT: Larry Gaines | Power Cycle Trading

  • Why using Option Butterfly Strategy works well in today’s markets
  • Four major benefits of using Butterflies to generate low-risk income
  • The Butterfly setup and most important Option factor to focus on

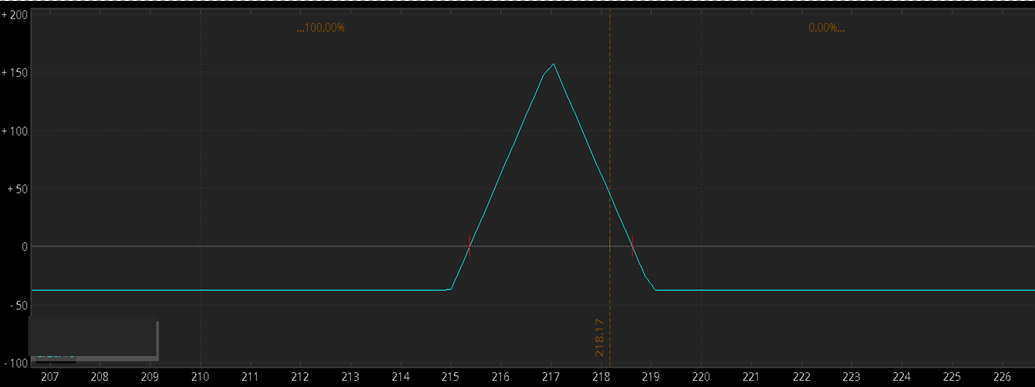
The Option Butterfly provides a [low risk - high reward] trading opportunity that can be used to trade any market environment, but it’s this dynamic option strategy that’s my Go-to-Trading Strategy for Uncertain - High Volatility Markets.

Markets can go through months, and even years of higher than usual uncertainty. Technical analysis may be painting one picture, while the economic or political environment is painting another. This can be both stressful and costly. But the Butterfly strategy offers a solution to this dilemma that all traders face on a regular basis. 

While there’s always some degree of uncertainty that traders and investors must accept, there can be long frustrating periods of higher than usual conflicting signals. This increases risk for traders and investors. Yet, waiting on the sidelines has opportunity costs. For traders who have come to rely on regular income from trading, loss of that income can cause serious lifestyle problems. These situations call for a strategy that will work no matter which direction the market heads.

That’s exactly what the highly versatile Butterfly strategy does. It gives you a trading advantage in any type of market environment. This makes it a powerful strategy that every serious trader will want to add to their arsenal of skills.

Many traders know of the advantages of the Butterfly, yet they may have avoided it because of its complexity. Initially, the setup can seem overly complicated. This is because most traders try to master the Butterfly without truly understanding a few basic option trading principles first.

In this presentation, I’m going to simplify the Butterfly for you. The reality is that once you grasp these basic concepts, you’ll see that the Butterfly is just marrying a couple of simple setups that you probably already know.

Serious traders take the time to master these skills to increase their returns while lowering their risk and the Option Butterfly is one powerful way to do this.

Since many traders avoid the Option Butterfly, by taking time to master it is going to give you a powerful edge up on traders who continue to avoid it.

Here is what you’ll learn

  1. Best Market Conditions for Butterflies
  2. Benefits of Butterflies
  3. The Option Greeks You Need to Know First
  4. The Most Important Option Factor         
  5. The Butterfly Setup

I. Best Market Conditions for Butterflies

Unlike other option strategies such as iron condors, credit spreads, or debit spreads that only work with an identified objective based on probable market direction, Butterflies can be set up and traded for a variety of objectives based on where a trader thinks the security or market is headed, as outlined below. One of the best things about Butterflies is that they are ideal regardless of market direction!

1. You Just Don’t Have Any Idea Where the Market is Headed

Non-Directional – Here’s the real beauty of the Butterfly! In their simplest form, butterflies can be delta neutral or non-directional trades. This means they can be used successfully when you simply DO NOT KNOW the market direction. Trying to pick the direction of stocks or the overall market can be stressful and expensive. Delta neutral butterflies can be set up to take the guesswork out of trading.

2. You Feel Pretty Sure the Market Is Headed Up or Down

Directional – The Directional Butterfly Spread can also be used for bullish or bearish exposure to the market while also managing risk and retaining large potential returns.

There’s no such thing as a free lunch: Butterfly spreads cannot offer unlimited profit potential. But they usually cost less than buying options outright while providing a powerful positive risk reward trade set-up that simply cannot be found with other trading strategies. 

3. You Don’t Want to Lose Your Shirt!

Hedging – The Directional Butterfly can be used as a fast to execute hedge on positions that are moving against you. This is exactly what the most sophisticated companies do. They hedge, and so can individual traders! Note: This lowers trading stress!

Constructing a butterfly around a strike that is under pressure from another core trade (such as a credit spread or debit spread) controls risk.

This allows you to keep the original position open, buying time. Often, additional time is all that’s needed for a trade to move back to profit territory. At that point you can then remove the butterfly hedge and stick with your original trade.

Butterflies provide cheap protection! Many longer-term investors and swing traders buy puts for portfolio insurance. Long term out-of-the-money put butterflies, however, can be a much cheaper method of portfolio protection than pure long puts.

II. Benefits of Butterflies:

Income - Butterflies can be used to generate income from stocks that appear to be going nowhere in the short term. This alleviates overall portfolio returns in flat markets.

Low Cost - Butterflies can best structured and traded at a very low cost.

Risk Reward - A 10-to-1 or higher Reward-to-Risk is common. This fantastic risk reward ratio makes them well worth the effort to learn the structure.

Low Maintenance – Butterflies are sometimes called “vacation trades” due to their low risk and need for only very infrequent monitoring.

  • Butterfly trades are generally very slow moving early on in the trade.
  • But get more exciting and volatile as they approach expiration and  are within the profit tent (Zone).

III. The Option Greeks You Need to Know First

The "Greeks" provide a way to measure the sensitivity of an option's price to quantifiable factors. The Greeks are strictly theoretical. That means the values are projected based on mathematical models and all of the best commercial options-analysis packages will do this, and on some of the better brokerage sites they are free.

Brief Review of the Greeks

Theta – (decay movement) measures your time decay (per day) – increases each day as it gets nearer EXP. & at zero at EXP.

Implied Volatility – (price movement) what the marketplace is “implying” the volatility of a stock will be in the future & its effect on where price will be

Delta – (price movement) measures the change per $1 change in the underlying & a measure of price probability

Vega – (volatility movement)measures the change per 1% change in volatility, decreases each day & at zero at EXP.

Gamma – (price movement)is the rate of acceleration of delta based on a $1 change in the underlying – most at risk & largest impact last week of EXP.

IV. The Most Important Option Factor

The most important option factor for profit generation using the Butterfly Strategy comes down to understanding the concept of TIME, and its effect on the price of an option…

Time Value ~ is used for trading strategies that take advantage of the accelerated Time Decay of an option into its Expiration.  Butterfly Strategies are very tied to Time Value (Theta) & the impact it has on the price of an option.

What exactly is Time Value?

Time value (TV) (extrinsic) of an option is the premium a rational investor would pay over its current exercise value (intrinsic value), based on its potential to increase in value before expiring. This probability is always greater than zero, thus an option is always worth more than its current exercise value. The change in the value of an option, based on Time Decay, can be measured using the Greek, Theta…

Option Theta

Theta tells you how much an option’s price will diminish over time, which is the rate of time decay of a stock’s option.

Time decay occurs because the extrinsic value, or the Time Value, of options diminishes as expiration draws nearer.

By expiration, options have no extrinsic value and all Out of the Money (OTM) Option expire worthless.

The rate of this daily decay all the way up to its expiration is estimated by the Options Theta Value.

Understanding Option Theta is extremely important for the application of option strategies that seeks to profit from time decay. 

Options Theta – Characteristics

Option Theta values are either positive or negative.

All long stock option positions have negative Theta values, which indicates that they lose value as expiration draws nearer.

All short stock option positions have positive Theta values, which indicates that the position is gaining value as expiration draws nearer. 

Theta value is highest for At the Money (ATM) Options

And progressively lower for In-The Money (ITM) and Out-of-The Money (OTM) options.

ITM and OTM options have much lower extrinsic values, giving little left to the decay.

For Example:

An option contract with Option Theta of -0.10 will lose $10 per contract every day even on weekends and market holidays.

The buyer/holder of an option contract over a 3-day long weekend with a price of $1.40 or $140 per option contract and an option theta of -.10 will find the price of that option at $110 instead of $140 after the 3-day weekend.

Theta Decay Strikes!

Option theta does not remain stagnant.

It increases as expiration draws nearer and decreases as the options go more and more In-The-Money or Out-of-The Money.

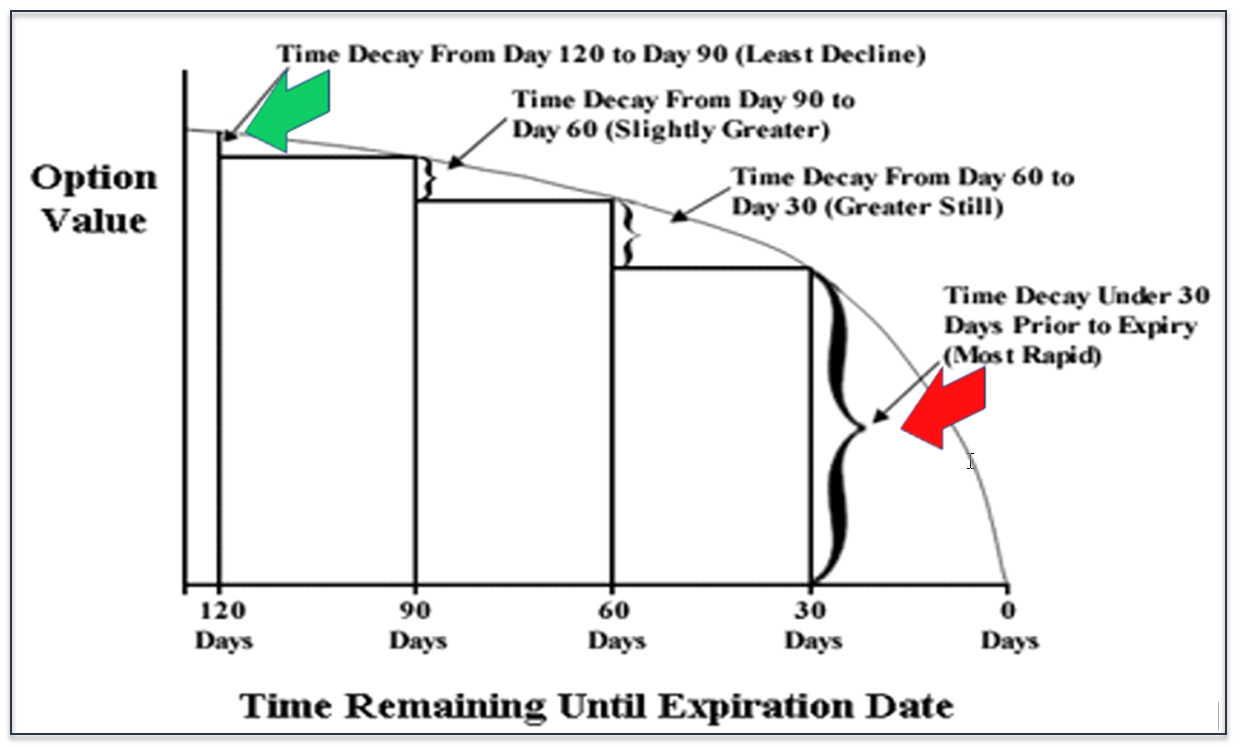
In fact, the effects of Option Theta decay is most pronounced during the final 30 days to expiration where theta soars. 

Take a look at the following chart to see just how predictable and powerful this option paradigm is!

During my presentation, I will walk through all of the specifics of setting up Options Butterfly trades, including examples and profit calculations.
 

ABOUT THE AUTHOR

Author: Larry Gaines, Founder
Company: Power Cycle Trading
Website: PowerCycleTrading.com
Services Offered: Trading Courses, Bootcamps/Coaching, Custom Indicators
Markets Covered: Stocks, Options, Futures

Larry Gaines has been involved in trading and brokering commodities and financial markets for over thirty years. Today, Larry trades options and futures, where he enjoys teaching others to generate income from trading using a disciplined systematic based on decades of trading experience.

Chapter 8

LIVE PRESENTATION • Wednesday, June 24th 5pm ET

Trading Futures Like a Well Trained Sniper

GUEST EXPERT: John Skelton | Apex Investing

  • How to be the sniper rather than the target
  • Learn semi-automated trading software
  • Establish 3rd party futures account funding

My name is John Skelton with Apex Investing Institute. I’m excited to share a short video here with you about how we are navigating the markets during this time of volatility and uncertainty. There are many systems out there that can give you a “possible” good set up. But possible is not good enough during these times. We focus on “probably” and not just “possible”. We are looking for the best of the best.

In this short video I will do a quick review of our Apex Sniper Trading System, that shows you how we focus on high probability set ups and utilize Apex Order Prints to see “inside the bar” to have a much better view of what is going and to help us not trade blindly. I will also show you a sneak peak of 3rd Party Account Funding and how to get a funded futures account as well as how we use Semi Automated Trading Software to execute these trades. 

THE MOVIE: TRADING FUTURES LIKE A WELL-TRAINED SNIPER

ABOUT THE AUTHOR

Author: John Skelton, Head of Operations
Company: Apex Investing Institute
Website: ApexInvesting.com
Services Offered: Trading Courses, Software, Trading Community, Funded trading
Markets Covered: Futures, Nadex, Stocks, Options

Apex Investing is a trading community with 30,000 traders in over 150 countries globally. ... To simplify trading, they have developed numerous tools that they have applied to futures, forex, stock, and option markets.

Chapter 9

LIVE PRESENTATION • Thursday, June 25th 10am ET

The VIX-SPY Option Strategy

GUEST EXPERT: Larry McMillan | Option Strategist

  • Favorite hedging strategy for high volatility markets
  • Realizing sizable profits regardless of market direction
  • Examples of this strategy performing in today’s markets

This article was originally published in The Option Strategist Newsletter Volume 17, No. 20 on October 24th, 2008 but still remains relevant today.

In the beginning of volatile time periods, one of the more profitable strategies has been the $VIX/$SPX hedged trade.  We have recommended it several times in many of the newsletters that we write.  Many of our readers have asked for more information on the strategy, as it is either new to them, or they haven’t tried to use if before.  So this article will describe the strategy in detail – discussing its basic concepts, determining how many options to trade on each side of the hedge, and finally how to handle follow-up strategies.

The hedged portion of the trade comes from the fact that, in general, $VIX goes up when the stock market goes down (and vice versa). Hence a purchase of similar options (puts or calls) in both instruments is a hedged trade.  For example, in theory if one owns calls on $VIX and also owns calls on $SPX (or more likely, on S&P SPDRS [SPY]), they hedge each other.  Similarly, if one owns puts on both, it is a hedged position. 

Furthermore, we like hedges in which options are used because one has two chances to make money: 1) if the hedge converges, or 2) if prices of the underlyings move a great distance, for on one side, the call can only lose a fixed amount, while on the other side, the call can profit handsomely.  To verify this, consider the following simple example:

Example: Suppose the following prices exist:

Nov $VIX futures: 42
$VIX Nov 40 call: 7
SPY: 90
SPY Nov 90 call: 7

Suppose one buys both calls (for simplicity in this example, assume just one of each is purchased). Later, the market falls sharply, and SPY plunges to 75. The SPY calls can lose, at most, 7 points since that was their cost. 

Meanwhile, the Nov $VIX futures rise to 65. The $VIX calls can gain substantially as $VIX rises.  In this case, they would be worth at least 25 (since they’re 25 points in the money).

So, did the spread between $VIX and SPY “converge?”  Probably not, but the second way to make money kicked in: the underlyings were extremely volatile.

The Basic Concept

We don’t establish the hedge at any old time, even though the inverse relationship between $VIX and $SPX always exists.  Rather, we use the relationship between $VIX and the front-month $VIX futures as a “trigger.”  When that differential is too great – either “too much” of a premium or “too much” of a discount – the trade is viable.

In less volatile time periods, we often would establish this strategy when that differential reached 2.0 points or more – either a 2-point discount or a 2-point premium.  Recently, with the extreme dislocations in the broad market and the acceleration of volatility, there have routinely been differentials of 8 points or more between $VIX and the front-month futures.  So, as a general rule, we want to establish the strategy when there is a “sufficiently” large difference between $VIX and its front month futures contract.  Eventually that differential must disappear – certainly by expiration, if not before.

Speculators might remember that such a condition usually precedes a broad market move, not necessarily a movement in $VIX.  Discounts on the futures have often led to market rallies, while premiums on the futures have been harbingers of market declines.

However, those speculators were dealt a heavy body blow in the last couple of months as repeated discounts on the futures didn’t result in a broad market rally.  So, a more neutral or hedged trader would want to try a more balanced approach – less capable of hitting a home run, but with a chance to make money in the two ways shown above.

In the past, the futures have generally proven to be “right.”  That is, $VIX moves to meet the futures (rather than the other way around), and $SPX moves the other way.  Let’s just look at a quick conceptual example:

Example:

Suppose the following prices exist:

$VIX: 31
$VIX front-month futures: 25
$SPX: 1200
(These roughly correspond to prices on 9/15/08)

Scenario 1: If the $VIX futures are “correct,” then $VIX will fall to meet their price, and $SPX should correspondingly rise as $VIX falls. 

Scenario 2: But what if the opposite occurred?  What if $VIX is “correct?”  Then the futures will rise to meet it.  In that case, $VIX might be unchanged, so $SPX might be unchanged as well.

So what strategy would work for these scenarios?  Buying calls on both!  Before explaining why, remember that $VIX options are priced off the futures as their underlying, not off $VIX itself.  We would want to stay in the “front-month” calls because that is where the greatest moves are.

In Scenario 1 above, the $VIX futures remain unchanged, and $SPX rises.  So $VIX calls might lose a little bit of time value premium, but SPY calls would profit nicely on the upward movement of $SPX.

In Scenario 2, $SPX remains relatively unchanged, while $VIX futures rise in price.  Thus SPY calls would lose a little time value premium, while $VIX calls would gain in value since the futures rise in price.

The Opposite Case: At many times earlier this, $VIX futures rose to a premium to $VIX.  That usually signaled a market downturn, but a hedged trader would want to use this $VIX/$SPX strategy in that case. He would buy puts on both $VIX and $SPX.  Again, here’s a short example:

Example:

$VIX: 18
$VIX front-month futures: 22
$SPX: 1400

Scenario 1: the futures are “correct,” so $VIX rises and $SPX falls.

Scenario 2: $VIX is “correct,” so the futures decline to meet $VIX, while $SPX and $VIX remain relatively unchanged.

In both cases, owning puts on both $SPX and the $VIX futures would be a profitable hedge.

How Many Options To Buy?   

The main question we get from readers is how do we determine the proper number of $VIX and SPY calls to buy?  Actually, there is a generic formula for determining a proper hedge when dealing with two different underlying instruments.  This is discussed in detail in the book McMillan On Options, and we have shown it many times in this newsletter as well:

Typically U is 100 shares per contract if stock or index options are involved, but if you are hedging futures options against stock, ETF, or index options, it is something different.

Volatility is typically the 20-day historical volatility, although in extreme times, one may want to take a broader view of volatility.

The Delta of the options is important only if you are, in fact, using options in the trade.  If you are hedging futures against ETF’s, for example, then there is no Delta component.

As a rule of thumb, historically, this formula generally tells one to buy about twice as many $VIX options as SPY options.  However, recent markets are not necessarily “typical,” and so the ratio has been changing.

Let’s use the same two examples from page 2 to determine how we’d set these ratios.  If we are trading $VIX options vs. SPY options, U is equal for both (100), and we’ll make the assumption that we are going to buy options with similar deltas.  Thus, only price and volatility determine the ratio:
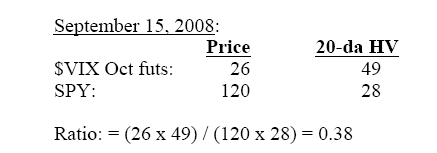
That is roughly 5-to-13, meaning we buy 13 $VIX calls and 5 SPY calls.  We didn’t actually establish a spread then, but that ratio was used in our subsequent spreads.

In reality, we did make a recommendation on October 2, 2008, when the discount on the $VIX futures was a whopping 11 points:
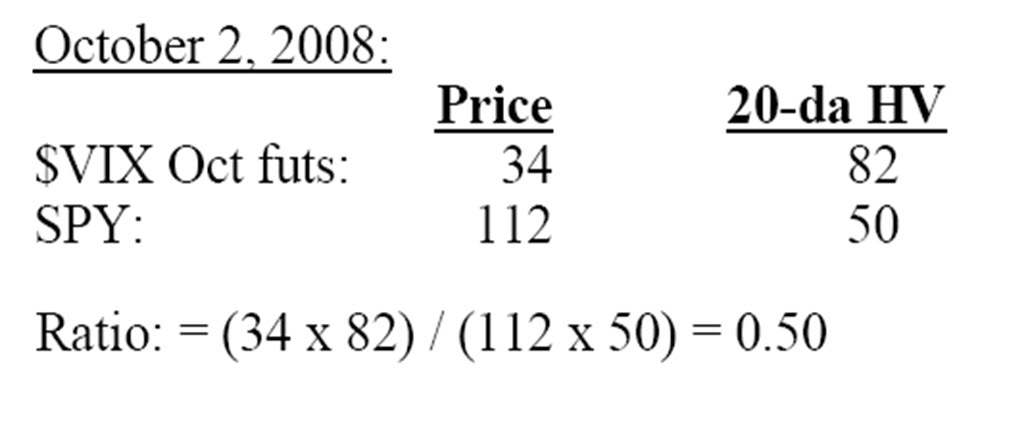
That is a 2-to-1 ratio: buy 2 $VIX calls for each SPY call purchased.

Finally, consider the example of 5/22/08:
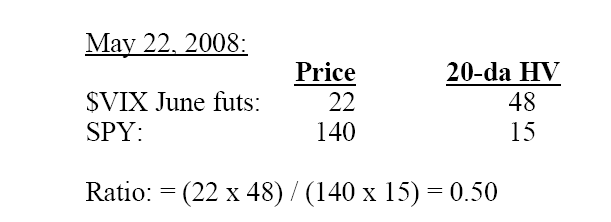
Again, 2 $VIX puts against 1 SPY put is the proper ratio.

Remember that these ratios need to be adjusted if one buys options with widely different deltas. 

Exiting/Adjusting the Hedge

Once the position is in place, we would want to remove it if $VIX and the front-month futures returned to a “normal” state in which they trade at more or less the same price.  That would be “convergence.”  However, we also know that there is another way to make money in this spread, and that’s if the underlyings move swiftly and sharply in one direction or another.

Consider the spread we actually established as Position I303 on the October 2nd Hotline:

Bought 13 $VIX Oct 32.5 calls @ 3.70
Bought   5 SPY Oct 112 calls @ 5.90

Total debit, including commissions: $7,832 The ratio was altered to 13-to-5 because the $VIX calls were out of the money, while the SPY calls were in the money, as we were (incorrectly) expecting SPY to rise and $VIX to fall.  As it turned out, of course, the market plunged and $VIX skyrocketed.

By October 9th, the following prices existed:

$VIX: 63.92
$VIX Oct futures: 52.29
$VIX Oct 32.5 call: 20.50
SPY: 90.75
SPY Oct 112 call: 0.05

The spread had not converged (there was still over an 11point discount on the Oct futures), but it was very profitable because of the large move that had occurred ($VIX rose, SPY fell).  At this point, it had become a directional trade, and we took a partial profit on 5 of the $VIX calls, setting a trailing stop for the balance.  We eventually sold the balance of the $VIX calls the next week, as the SPY calls expired worthless – a profit of over $30,000 on a relatively small investment.

A much more typical, smaller result was achieved in the position established last May.  See example on page 2.  In that case, the spread did “converge” as $VIX futures rose to meet $VIX and the stock market (SPY) fell.  So, we had a small loss on the $VIX puts and a larger profit on the SPY puts, for a net profit overall of $665 on an original investment of $5,396.

In general, “convergence” will result in relatively small profits, while the second way to profit – volatile moves – will result in much larger profits.  The second scenario is, of course, rarer than the first.

In either scenario, when profits build up, one should take partial profits.  If the futures remain at a significant differential from $VIX, the entire position could be “recentered,” to remove any extreme delta from one side of the position or the other.

What Can Go Wrong?

No strategy is infallible.  In this hedged strategy, the entire debit is at risk if $VIX and SPY “diverge” and yet they don’t make a volatile move.  That is unlikely over a sustained time period, but it can happen in the short term.

For example, on Tuesday October 21st, $VIX futures were at a large (8-point) discount entering the day, so one would be long $VIX calls and SPY calls.  However, that day, $VIX Nov futures fell by 1.05, while SPY also fell by 2.95 – causing losses on both sides of the hedge.  It would be unlikely for that situation to persist, but in theory anything can happen.

Usually, if there are losses on the hedge, the concept of the position is still attractive (i.e., $VIX is still trading at a significant differential to the front-month futures).  Hence, one could “average” down.”

Perhaps more common is the effect of $VIX on the SPY calls.  Suppose one owns calls on both, and $VIX is very high when they are bought.  Then the market rallies and $VIX declines.  The SPY calls that are owned are fighting an uphill battle against a declining $VIX, even as the underlying market is rallying.  This is less likely to be a problem when puts are owned on both, for if the market declines, $VIX rises – thereby helping the SPY puts.  In any case, this effect can be mitigated by buying options that are (deep) in the money, to minimize exposure to volatility (vega) and time decay (theta).

Another potential source for error is in the adjustment process.  If a large delta builds up on one side of the position or the other, one needs to either re-center the position or take partial profits.  Even so, the adjustments may generate losses – especially if the trader imposes a market opinion on the adjustment.

Summary

In summary, this hedged strategy is an excellent way to trade volatility.  That is, the position sets up when the $VIX futures are “predicting” a movement in either volatility and/or the stock market that can be captured with this trade. While it could be traded with $VIX futures, the approach of using options is superior because of the open-endedness of the option position (i.e., its ability to make profits on volatile moves by the underlyings, regardless of whether or not the futures differential converges).

ABOUT THE AUTHOR

Author: Lawrence McMillan, Founder
Company: McMillan Asset Management
Website: McMillanAsset.com
Services Offered: Trading Education, Account Management Services
Markets Covered: Stocks, Options

Lawrence is well-known as the author of “Options As a Strategic Investment”, the best-selling work on stock and index options strategies. The book – initially published in 1980 – is currently in its fifth edition and is a staple on the desks of many professional option traders.

Chapter 10

LIVE PRESENTATION • Thursday, June 25th 11am ET

4 Chart Patterns Every Trader Should Know

GUEST EXPERT: Tom Busby | DTI

  • Learn 4 chart patterns every trader should recognize in the market
  • Knowing if you should be long, short, or out of the market
  • Eliminate one of those choices and increasing accuracy to 67%

In this presentation, i will focus on on the four chart patterns you need to know when analyzing markets, I will also talk about something we call the "Seven Sisters", so that people can understand what we follow at DTI throughout a 24-hour market cycle.

First of all, we need to ask ourselves a question. Should I be Long, should I be Short, or should I be Out-Of-the-Market?

Eliminate one of these, and you can increase your odds of success by 67%

This short video will explain what I'm talking about.

THE MOVIE: 4 CHART PATTERNS EVERY TRADER SHOULD KNOW

ABOUT THE AUTHOR

Author: Tom Busby, Founder
Company: Diversified Trading institute
Website: DTItrader.com
Services Offered: Trading Education, Trade Alerts, Trade Rooms, Software
Markets Covered: Stocks, Options, Futures, Day Trading, Swing Trading

Tom Busby’s trading career dates back to the late 1970’s. Quoted and published in Futures magazine and Active Trader Magazine, he actively trades and invests in futures, stocks, options and currencies.

Chapter 11

LIVE PRESENTATION • Thursday, June 25th 12pm ET

Is Your Computer Fast Enough to Trade With?

GUEST EXPERT: Eddie Z | EZ Trading Computers

  • Why it’s important to trade with a fast computer
  • Finding out if your PC is good enough for trading
  • Features to focus on and ignore in new computer

Hello, my name is Eddie Z, and I am a 33-year Wall Street veteran and a lifelong computer geek. As a full-time stock trader and geek, I have a developed a unique perspective on trading technology and have learned what it takes to have a super fast and reliable trading computer system. My goal in this guide is to pass that information on to you, so that you can succeed as a trader.

There are several companies on the internet selling “Trading Computerswith literally thousands of dollars of profit built into them. I am here to tell you that despite their slick websites, they sell nothing special. In fact, many times they confuse you and try to sell you things you really don’t need. What’s worse is that these people are not traders like us. They simply do not speak our language.

The purpose of this guide is to help you determine if your computer is really fast enough for trading.

So, at this point, you may be asking yourself:

  • What is a Trading Computer?
  • Why do I need a special computer for trading?  
  • Can’t I just use my existing machine?

A “Trading Computer” is a very fast, superior piece of technology, designed to maximize the trader’s ability to interface with the markets and make decisions in real time. The key qualities of a great Trading Computer are speed, reliability, after the sale service/support, and multiple monitors. 

The most important reason traders absolutely need a Trading Computer is to avoid something called “slippage”. Slippage is when you enter an order to buy or sell, and the price you get filled at is much different from what you expected. Generally, slippage occurs because the trader is using a mass-manufactured, lower-end computer that is not displaying price information in real time. This price data may be off by just a fraction of a second, but it’s enough to throw off your entire trading methodology. 

Have you ever been to a sports bar where they are showing the exact same game on both a High Definition TV and an old-school, regular TV; and the game on one TV is actually a second or so ahead of the other? Slippage is a very similar phenomenon, and it costs traders a bundle. 

Most traders don’t realize that mass-manufactured computers, and the mainstream processors from just a few years ago, just can’t keep up with today’s mega levels of streaming price data. So if you have a computer that is just 2 or 3 years old that you bought at BestBuy, most likely you are going to have data issues and bottlenecks.

That brings me to an important point: forget about going down to BestBuy, OfficeDepot or Walmart to buy an HP, Lenovo or Dell computer. These mass manufacturers use inferior components, inferior wiring and low-end motherboards in their systems; and their tech support outright sucks (unless you like calling call centers in the Philippines!). You will NOT save money buying one of these mass-manufactured machines. Additionally, most of the mass manufacturers only include a 1-year warranty. As for the kids who work at these retailers, they have NO IDEA what you need as a trader.

Instead, plan on having a system professionally built and customized for you. Believe it or not, having a system built for you will NOT cost you more in price than going down to BestBuy. In actuality, it will cost you less if you consider the cost of slippage, set-up, downtime, headaches and frustration.

SPEED: The biggest contributor to speed in a computer comes from a component called the Processor.  The Processor is the engine of the computer.

Traders need the most powerful processors on the market to optimize their trading software! Trading software is extremely resource intensive.

The processor needs to be able to handle the MASSIVE volume of real-time data points and information we take in through our internet connection as traders. Think of all the price data, tick data, time and sales data, historical chart data, as well as the myriad of other information that is streaming to our machines.

Your trading software, besides showing you quotes, has to take these thousands of data points per second and compute analytics, quantitative indicator computations (sometimes dozens) and draw charts that are changing dynamically - in real time.

Additionally, traders use their computers for dozens of other applications that are resource intensive such as online trading/teaching rooms that make use of GotoWebinar and Zoom. Online video streaming such as CNBC, Bloomberg or CNN are also extremely resource intensive.

Now add in any other applications you use such as Excel, Outlook, Chrome, Skype, etc. and you can see your processor has to manage a LOT of tasks.

So as a trader, you never want to skimp on processing power and speed.  

Think of the processor as the main engine of the computer. The more horsepower the processor has, the faster it can process data and streaming information, and the less chance you will have for slippage and slowness.

The ultimate measure of computer horsepower is found by running something called a CPU Benchmark Test. This like taking your car down to a special tuning shop and having them test EXACTLY how much horsepower is coming out of the drive train. (In the car world, this is known as a “Dyno Test” on a dynamometer.)

The minimum amount of “horsepower” a trading computer needs (and this is really the bare minimum) is a CPU Benchmark Score of 12,000. This number may mean nothing to you without anything to compare it to.

Just to give you an idea, Dell, as of this writing, is selling their new Inspiron 22 3000 Desktop with the Intel i5-8265U processor which has a disappointing benchmark score of just 7986.  This is NOT fast enough for trading. 

Remember, the minimum Benchmark Score required to avoid slippage as a trader is 12,000.

Your best bet is to check the EXACT amount of horsepower of your current computer by visiting this CPU Benchmark Test Page -> https://bit.ly/ezcputest .  I think you may be surprised to learn that over-the-counter; store-bought computers are almost always underpowered.

As of this writing, here are my top processor picks for Traders.  These are chosen for their power and speed as well as for their value. 

Processor Recommendations for Traders:

Processor:

Benchmark Score

Comment:

Intel Core i5-9400


12,800

Intel’s latest i5 is the first of its kind to generate this much speed. This processor sets the bar in terms a speed and value.

Intel Core i7-9700K

17,750

Intel’s New 8-Core Processor.  A huge jump in power from the previous edition.

AMD Ryzen 5 3600X

20,510

AMD’s direct attack on Intel’s Market share. A VERY fast CPU and Fantastic Value

AMD Threadripper 3990X

81,000

This is the Fastest Consumer Processor we have ever tested. AMD is giving Intel a run for its money


Intel vs. AMD

So at this point, you probably asking - “Which brand of processor should I choose?”

Years ago, I would have pointed you exclusively to Intel.  Intel had been the gold standard when it comes to processors in terms of power, speed and quality all the way up until the end of 2018.  Up until that point, AMD (formerly known as Advanced Micro Devices) focused exclusively on the lower-end of the computer market and on graphics cards. 

However, in 2019, all of that changed. AMD has gone directly after Intel’s market share by releasing some very fast processors at very attractive price points.  In our production facilities we have tested these new AMD processors with full force and I can honestly say they now make excellent products for traders.  Excellent enough that we are willing to warranty their products for a full 5 years!  AMD’s regular warranty is 3 years.

If you are old school or brand loyal then go with Intel.  They still make excellent products.  If you want more bang for the buck, AMD is the right choice.  With AMD processors you will get a lot more speed for the money and the amount you save can be used to upgrade the hard drives and memory.

In terms of speed, the Intel 9th Generation Core i5-9400 is the only Core i5 to ever make our list.  Any Core i3 or Core i5 with a lower number simply does not meet the benchmark score requirements.

All of the older AMD, Intel i3 and Intel i5 series processors are equivalent to 4-cylinder car and you won’t have the power you need to do everything you want in the markets. 

I must repeat: the benchmark score is the ultimate measure of performance. The higher the benchmark score the better for you as a trader.  The minimum benchmark score for traders is 12,000.  

Check your computer’s benchmark score NOW by going here -> https://bit.ly/ezcputest .

The following processors are obsolete and should NOT be used by traders: Pentium, Pentium 4, Pentium Dual, Core2 Duo, Core Duo, Dual Core, Celeron, Core2 Quad.  Even lower-number i7’s (like the i7-2600) and any i7 with a U at the end (i.e. i7-7600U) are NOT fast enough to trade with and should be avoided.  Advanced Micro Devices (AMD) has many lower-end chips, too.  DO NOT BE FOOLED.  They must all have a benchmark score over 12000 or you are wasting your money.

ABOUT THE AUTHOR

Author: Eddie Z, Founder
Company: EzTrading Computers
Websites: EZTradingComputers.net, EZBreakouts.com
Services Offered: Custom-Built Trading Computers, Trading Education, Stack Market Direction Calls
Markets Covered: Stocks, Options

Russ Hazelcorn, better known as Eddie Z, is a full-time day trader, educator, and total computer geek. He is the creator of www.EZBreakouts.com and EZTradingComputers.net

Chapter 12

LIVE PRESENTATION • Thursday, June 25th 1pm ET

Conquering Uncertainty in Volatile Markets

GUEST EXPERT: Rick Saddler | Hit & Run Candlesticks

  • The most import thing to remember in volatile markets
  • These seven simple questions will eliminate uncertainty
  • My favorite strategy for spotting high probability entry points

In these volatile, uncertain economic times, wouldn't it be nice to just look at a chart and know exactly where the next likely market moves will be? In this short video, I'm going to show you several naked charts with no indicators. I will mark them up with key zones you need to watch.

In my live presentation,  will take these naked charts and start plotting the indicators you will need to use. You will learn where to enter trades, where to place your stops, and how to identify exit targets.

Make sure to catch my live presentation. Once you learn our methodology, these wild market conditions we are witnessing will be less intimidating.

THE MOVIE: CONQUERING UNCERTAINTY IN VOLATILE MARKETS

ABOUT THE AUTHOR

Author: Rick Saddler, Founder & CEO
Company: Hit and Run Candlesticks
Websites: HitAndRunCandlesticks.comRightWayOptions.com
Services Offered: Live Trading Room, Trading Education, Software
Markets Covered: Options, Futures, Stocks, 

Rick Saddler has 29 years of experience coaching traders to enter with low-risk on short-term trades, grabbing profits and sleeping well at night. His bottom line has become simplicity equals success.

Chapter 13

LIVE PRESENTATION • Thursday, June 25th 2pm ET

4-Steps to Simplify Your Day Trading

GUEST EXPERT: Marina Villatoro | Trader Chick

  • Spot and avoid consolidation and transitional areas
  • Reversals, divergence and changes in market direction
  • Quickly scan for breakouts and prime trade setups

Trending Markets In Uncertain Conditions – What You Will Learn

In uncertain, volatile markets, it's imperative to know exactly how to read the markets. Otherwise, you are flying blind, which is a recipe for disaster. Get ready to dive in and get started on how to read the markets.

Market Movements

Let’s start with market movement.

Here are the basics of the basics – markets move in three ways and three ways only!

  1. Up – when the price is going higher and higher
  2. Down – when the price is going lower and lower
  3. Sideways – when the price is stuck between two points and is bouncing off of them for a period of time

Once you truly understand this, you are well on your way.

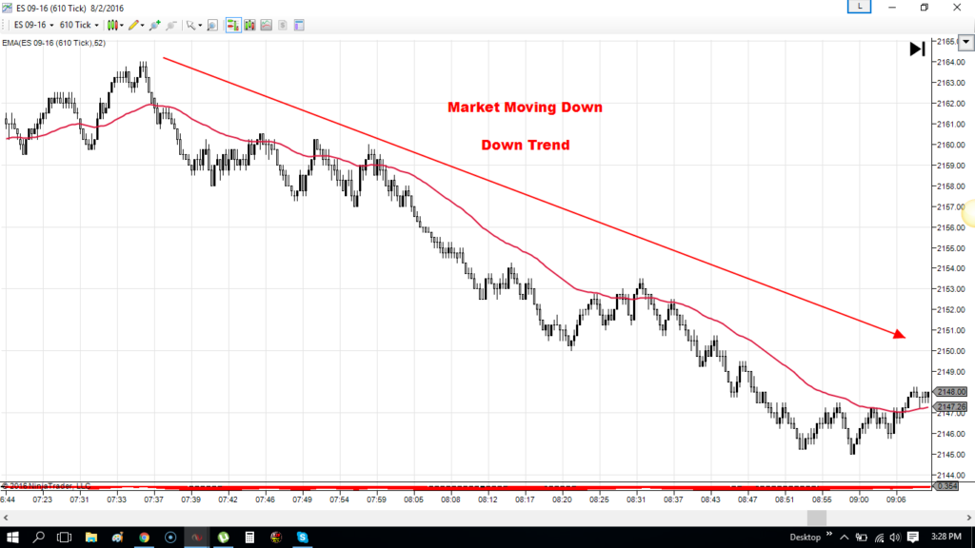
Normally when we hear trending markets it usually means the market is moving in one direction.

The market can have a trend up – market trending up


The market can have a trend down – market trending down

The market can be trending sideways.

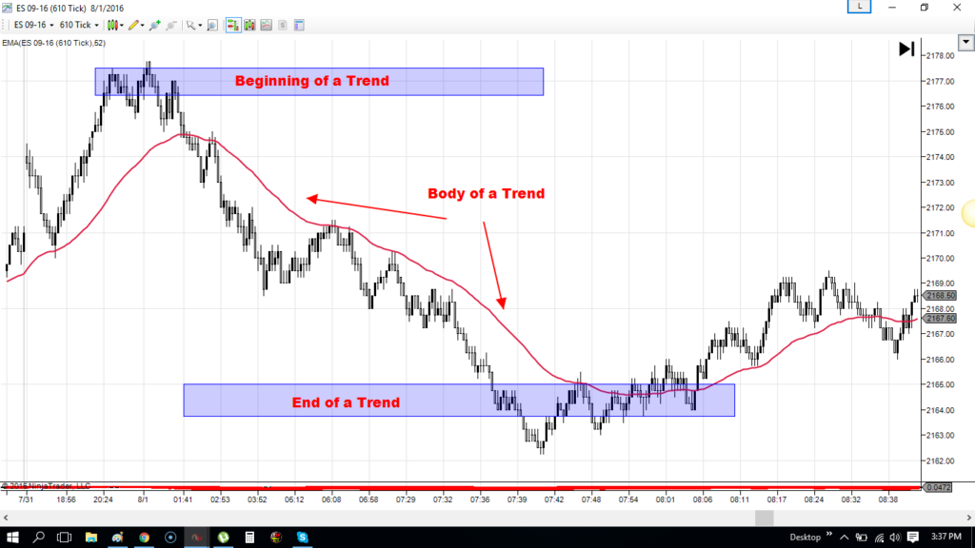
Important to note – when you are day trading think of precision! Like a doctor working with a scalpel, you need to look at the entire picture. For example, when you are looking at a trend, don’t look at the middle of it but see it from where it starts to where it ends. It’s crucial to start forming good habits from the beginning. And being precise will get you far.

You will hear terms such as ‘Trend traders’ but that usually refers to traders trading a trend either heading up or heading down. Sideways trending markets are the hardest to trade and with the least probabilities of winning (for beginners I don’t recommend sideways markets for trading).

Anatomy of a Trend

We are going to break the trend up into chunks to get the full understanding of what is happening.

3 Main Components of a Trend:

When reading the markets it’s all about movement, about the direction of the trend and most importantly understanding the essence of the trend. Once you can read the signs of what a trend is doing, you are more equipped to get into trades that will go in the right direction at the right time.

  • The beginning of a trend – this is usually strength gaining – this is the best time to hop on the trade bandwagon
  • The middle of the trend – runs with weak retracements – helps gauge what the trend is up to and if taking more trades, or staying in the trade you are in is the right decision
  • The end of a trend  – exhaustion – when there is a lot of consolidation, slowdown, this is the transition area. It is called the end of a trend because here the trend can go into 2 different directions, it can either continue or shift to a new direction and
    start a new trend.

Dissecting the Trend

Now that we know the components of the overall trend, the most important part is looking at what actually happens within a trend so we understand what is truly happening.

The Dissection of a Trending Market

The market will never move in a straight line up or down. Every type of movement you see on your charts is either trending up, trending down or trending sideways.

For us to understand the fundamental elements of the market, we must understand the vital components of a trending market.

The Key Components of a Trend either up or down:

Run – this is when the market is going in one direction. It can be a strong run, or slow and steady. As long as the highs are higher and the lows are higher if going up. And as long as the lows are lower and the highs are lower for a downward trend.

There are 2 different runs that you need to understand:

Strong Run – this is showing us that the market is gaining speed in the direction and, with weak retracement (explanation below) shows us that it will continue. Strong runs also have sharp angles to them.

Weak Run – This is a slowdown in the trend. This means that the trend is either slowing down ready to change direction or simply taking a breather before continuing on it’s way.

Retracement (Pullback) – Every run retraces, or corrects itself, by going  in the opposite direction of the run. We need to understand the strength of the retracement. Is it a small retracement and the market is simply taking a breather before it continues in the same direction? Or is the market correcting itself with a deeper retracement and slowdown? Maybe even about to change direction altogether.

The market moves due to people’s emotions. Fear usually makes them panic and that’s why you will see the market run faster going down, then going up.

Runs usually occur because everyone is hopping on the bandwagon of the trend.

Retracements occur when people want to get out of their positions. Most commonly, retracements are smaller than the run. Retracements are important to watch closely because this is the place for the best entries or, could be, the worst.

Deeper retracements are places where indecision is coming in. Doubt that the trend will continue and traders are getting out of their positions that were going with the trend, and new traders are coming in and buying positions for the trend going in the opposite direction. When this happens, this gives the retracements strength to continue in the new direction and a new trend has begun to form.

Our goal is to watch the strength of the runs and retracements to see when there are slowdowns and shifts in direction. As individual day traders our goal is to go with the flow, movement, momentum of the market and get on the right side of the trend.

Understanding Trend Strengths and Weaknesses

Now let’s dig even deeper into a trending market.

A trend (up or down) can be strong with strong runs and weak retracements.

A trend can also be slow and steady, not real strength but still making higher highs or lower lows. This type of trend has retracements that can be deeper yet holding its course.

What are higher highs and higher lows –  this happens in a trending up market. This is when the last pivot on the upside is higher than the pivot before it. And the last pivot on the bottom is higher than the last low.

What are lower lows and lower highs – this happens in a trending down market. This is when the last pivot on the bottom is lower than the previous one. And the last pivot on the other side.

Momentum helps us understand the strength. If it’s strong, chances are when there will be slow downs (retracements) it will continue in the same direction. Keeping the momentum going.

Important to note, with slower trends and weaker momentum, the probabilities are much higher for a change in direction. We need to be vigilant of this.

Trending market can also go sideways. You won’t always have a trend going up or down, there will be times when it will go sideways, also known as a channel, or a consolidation. This has no momentum.

Momentum is when you are picking up speed and flowing in a certain direction.

ABOUT THE AUTHOR

Author: Marina Villatoro, Founder
Company: The Trader Chick
Website: TheTraderChick.com
Services Offered: Trading Education, Boot Camps, Trading Community
Markets Covered: Futures, Equity Indices and Commodities

Marina Villatoro built TraderChick.com as a community for like-minded traders sharing the same issues that she was facing when she started her trading journey.

Chapter 14

LIVE PRESENTATION • Thursday, June 25th 3pm ET

A Simple Technique for Trading Volatile Markets

GUEST EXPERT: Vince Vora | Trading Wins

  • Why simplicity and consistency is the key to success
  • My favorite simple strategy for trading with the trend
  • How simple moving averages can be your best friend

Most traders tend to overthink trades and make their analysis more complicated than it needs to be. They’ll keep adding indicator after indicator, in the hopes of finding the perfect system. Let me tell you, that perfect system does not exist. I know because I used to try to find it too.

In this volatile market, the key is simplicity and consistency. Watching the financial news is NOT a good idea because the talking heads on the networks are not looking out for your best interest. What you need is your own strategy, one that keeps you level-headed when markets are gyrating.

The simple strategy that's featured in this short video is based on the Guppy Multiple Moving Averages. And, it can be used for short-term trading (from 1-5 minutes) to longer investing periods that range from months to years.

In the field of technical analysis, your chances of success increase substantially when you are trading with the trend. Counter-trend trading is best left to traders whose appetite for risk is substantial. The Guppy system will help you quickly identify changing trends with simple moving averages. It's a system that anyone can learn and benefit from. Once you've identified a real trend, you'll see how you can confidently put on simple trades or use options to leverage your position and manage your risk.

THE MOVIE: A SIMPLE TECHNIQUE FOR TRADING VOLATILE MARKETS

ABOUT THE AUTHOR

Author: Vince Vora, Senior Trader
Company: Trading Wins
Website: TradingWins.com
Services Offered: Trade Alerts, Daily Market Commentary, Nightly Videos
Markets Covered: Stocks, options, Forex, Futures

Over the last three decades, Vince has been trading and refining his trading systems that are based on technical analysis and price action. Over the last few years, his focus has been on teaching people how to become better traders.

Chapter 15

LIVE PRESENTATION • Thursday, June 25th 4pm ET

A Super System for Trading Volatile Markets

GUEST EXPERT: Rob Mitchell | Axiom Research & Trading

  • The four primary factors that make up market movement
  • Why leveraging these factors improves probability for success
  • How adding a fifth factor creates a Super Trading System

One of my favorite approaches to the markets and conquering uncertainty has always been trading in high volatility.  This approach benefits from profiting during times where most investors are taking heat and then also it works just as well in quiet times as well.  This involves trading in the highly volatile intraday swings of the market with tight risk parameters and control while understanding the four primary factors that make up market movement.  This approach is structural to the market so it benefits from a nice edge with prospects for long term success and reliability.  

These four primary factors that make up market movement are:  Price Action, Order Flow, Momentum and Support and Resistance.  When these factors are lined up, you get theoretical probability stacking in your favor leading to high theoretical win percentages in your trading.  So, the four basic factors combined together and add a fifth, quintessential factor that makes-up what I call a Super System

The concepts used in this approach hold within them some of the greatest secrets of successful trading systems known to traders and that stand the test of time.  In this short video I will cover one of the five secrets.  Then, we will do a webinar that covers more of these methods into a cohesive plan, and putting it all together into a Super System.  Don’t miss it!

THE MOVIE: BUILDING A SUPER SYSTEM FOR TRADING VOLATILE MARKETS

ABOUT THE AUTHOR

Author: Rob Mitchell, President
Company: Axiom Research & Trading, Inc.
Websites: IndicatorSmart.com
Services Offered: Trading Education, Trading Room, Custom Indicators
Markets Covered: Stock Indices, Commodities Futures

Rob has been the largest Emini S&P trader in the world at various times and has won the prestigious Robbins World Cup Emini Trading Championship.

Chapter 16

LIVE PRESENTATION • Thursday, June 25th 5pm ET

Trading the Death Star

GUEST EXPERT: Matt “Whiz” Buckley | Top Gun Options

  • Why diversifying your investments may be a mistake
  • Risks and Benefits of trading a “solo” stock
  • Laser focused strategies for maximizing profits

Former Navy fighter pilot and Wall Street superstar Matthew 'Whiz' Buckley covers 'Trading the Death Star', completely destroying the Wall Street myth that investors MUST diversify. 

In this brief he covers the ONE stock that investors MUST trade, while ditching everything else. A wise investor once said "Diversification is for those that don't know what they're doing'.

The Death Star?

AMZN

There are many advantages to focusing on trading in one solid name like AMZN:

• You trade the same name and potentially profit no matter what direction AMZN moves – up, down, or sideways
• You stay focused on the news that impacts AMZN instead of many different stocks or ETFs
• You become an ‘expert’ in the name, reducing time spent on other positions
• And many other benefits 

THE MOVIE: TRADING THE DEATH STAR
 

ABOUT THE AUTHOR

Author: Matthew “Whiz” Buckley, Founder
Company: Top Gun Options
Website: TopGunOptions.com
Services Offered: Trading Courses, Mentorship, Trade Alerts
Markets Covered: Stocks, Options

Whiz is a highly experienced financial business executive, and decorated Naval Aviator who graduated from Naval Fighter Weapons School (“TOPGUN”).