Chapter
01

3 Trading Secrets to Win Every Day in the Markets

By Bryan Bottarelli, MTAtradeoftheday.com

With these 3 powerful trading secrets you can create wealth each and every day in the markets.

There’s a good chance you’ve never seen these before. But once you master them, they’ll open your eyes to opportunities that – until now - have never been explored.

I hope you’re excited – because understanding these techniques could literally change your life.

And on that note – let’s dive right in!

Trading Secret No. 1: Use a 3-Minute Chart
 

The first secret will set the tone for the other four. It deals with how to properly track stock moves on a day-to-day basis.

You see, most traders will give you a chart analysis based on a daily chart – or a weekly chart – or sometimes even a yearly chart.

But when you think about it, that’s the wrong approach. After all, daily, weekly and yearly charts are all using old data. They’re backward-looking. All of those moves are known to the world – and they’ve already occurred. They’re over and done with. Attempting to profit off a chart formation that’s already happened is like trying to cash in a daily lottery ticket using yesterday’s winning Powerball numbers.

That’s why your first secret is to trade by tracking the minute-by-minute movements of a stock using a 3-minute chart.

If you switch your charting software to a 3-minute time frame, you’ll see a new price bar form every 180 seconds – which gives you a live, real-time look at the stock price movements within that time frame. Any number of transactions could appear during this period, and they’re all encapsulated into this one powerful price tick.

Below is a screenshot of a 3-minute price chart on Dollar General (NYSE: DG).

Can you see the double bottom that formed right above the $162.50 level? Pretty clear, right? However, if you’re not tracking a 3-minute chart – or if you’re looking at a daily Dollar General chart – there’s no way you would know that this level has offered double-bottom support. This is just one small example of how beneficial the 3-minute chart can be for you.

Knowing how to use a 3-minute price chart to identify winning trade formations in real time will change the way you trade forever. Let’s explore how you can combine this with secrets No. 2 and No. 3.

Trading Secret No. 2: Track a “W” Pattern

 Okay, now that you’re using a 3-minute chart, let’s reveal exactly what you should look for.

To begin, the stock market is a constant war between bulls and bears. Watching the 3-minute price chart shows you the battlegrounds that determine who wins each directional fight.

As you’ll soon see with your own eyes, minute-by-minute trading is always a series of tests and price probes to ultimately determine a dominant direction.

One way to properly “decode” this ongoing tug of war is by looking for “W” and “M” patterns using a 3-minute price chart.

Watching these two patterns play out will reveal to you whether the bulls or the bears have temporarily won (or lost) the directional battle. Whenever one of these patterns completes itself (which means that the losing side has retreated), this tells you that the winning side is now free and clear to move the stock in their direction.

Whenever this “free and clear” pattern occurs, you can typically join the winning side for a quick and easy intraday winner.

Let’s walk you through one real-time example step by step using the “W” formation...

Here’s a 3-minute price chart of Toll Brothers (NYSE: TOL).

As you can see, Toll Brothers gapped up to $38.40 – which is where the bears sold it – causing it to retrace back down to $37.40. This is where the bulls bought in – causing a mini jump to $37.60. At this point, the tug of war has begun! And in the process, you can see the “W” pattern starting to take shape – noted in blue.

At this point, we’d be carefully watching the action. Why? Because a move above the $37.70 level (which is the middle point of the “W”) could be an indication that the bulls have temporarily exhausted the bears – and the remainder of the “W” pattern would be free and clear to play out.

Here’s what happened next...

As you can see, Toll Brothers did indeed move above the $37.70 level – thus indicating that the bulls regained control from the bears - and the “W” pattern is now free and clear to play itself out. This is when you would get an alert to buy Toll Brothers calls in our trading recommendation room.

And here’s how the formation was completed...

With the bears temporarily on the sidelines, the bulls were able to push Toll Brothers all the way back above $38, which resulted in a quick and easy intraday winner.

So when you see a “W” pattern, you’d play an upside call. Properly identifying this pattern in real time – and playing it when there’s a “free and clear” moment – can open your eyes to daily trading opportunities that you’ve never been exposed to before. These are the sorts of patterns you’ll receive as a member of Monument Traders Alliance.

And guess what?

These patterns are happening every single hour – of every single trading day!

A clean version of the “W” formation looks like this:

And in real life – using a 3-minute chart – it looks like this...

Trading Secret No. 3: Track an “M” Pattern

Okay, so a “W” pattern is what you play when stocks are moving up.

But what happens if stocks are moving lower?

Well, that’s where secret No. 3 comes into play...

It’s called the “M” pattern, the polar opposite of the “W” pattern you just learned about above. You trade it using the exact same process as described in the “W” above – only this time, the bears win and an “M” pattern forms.

The “M” pattern looks like this...

As you can see, the “M” occurs when the bears win the directional tug of war – and they push a stock lower.

In real life – using a 3-minute chart – it looks like this...

Each and every day, tracking these powerful “W” and “M” formations can generate daily wealth for you. They happen all the time. You just need to know what you’re looking for!

Now that you’ve seen our 3 Trading Secrets...

We can help you get started with this one-time special discount:

THE SPECIAL OFFER

5 Trades for $5.

We’ve already got an 86% win rate...

Don’t take my word for it, here is our complete track record:

Now... we’re offering our next five trades for less than the price of a fancy coffee.

No reoccurring payment. No renewal fee. No B.S.

ABOUT THE AUTHOR


Author: Bryan Bottarelli
Company: Monument Traders Alliance
Website: MTAtradeoftheday.com
Services Offered: Trading Chatroom, Weekly Trading Newsletter, Daily eLetter

Chapter
02

TOM GENTILE’S 10-TRADE GIVEAWAY

By Tom Gentile, PowerProfitTrades.com

Hi, my name is Tom Gentile.

And I’m living proof that despite everything that’s happened recently – and everything that is still happening across the country…

The American dream is still alive and well.

Maybe even more so than ever before.

Over the past 30 years, I went from a college dropout, to stocking shelves, to having enough money for my wife and me, plus my two young adult children to retire whenever we wish!

But this isn’t about me, it’s about you.

If you are concerned about building your own wealth then know this:

  • The media is feeding you misinformation on a daily basis.
  • Wall Street certainly doesn’t have your back.
  • And the politicians in Washington – forget about it…

These people don’t want you to be rich, and they don’t even want you to be financially independent.

My path to success is about as unorthodox as it gets…

  • I don’t follow market trends…
  • I don’t sift through financial statements…
  • I don’t read earnings reports…
  • I don’t gamble on penny stocks…
  • And I certainly don’t rely on dodgy indicators or blips on a chart.

I’m what they call a pattern trader.

My mission is to profit from the most consistent moves in the market.

Moves that repeat themselves over and over again…

During the same periods of time nearly every year.

But here’s the thing…

The technology I use to hunt for these patterns is proprietary

Write this symbol down:  AMAZON (AMZN)

Why do I want you to write this down?

Because even though Amazon has been trading flat for the last six months…

Its shares are projected to go on an epic 11-day price run, starting November 15 and ending November 29, 2021.

And this price run is set to boost Amazon’s stock by $22.

How do I know this?

Because I have data showing me how Amazon’s stock has made this same exact price jump…

Over this same exact 11-day period…

In nine out of the last 10 years!

Most people have no idea how to leverage these kinds of small price jumps.

But as a pattern trader, I can turn even a 1% gain on Amazon into a…

25%, 50%, or 100% windfall in a matter of weeks (sometimes days).

How is that possible? By identifying stocks that are historically likely to make large moves within a specified time period, and then trading options.


Get Tom Gentile’s 10-Trade Giveaway Here
America’s #1 Pattern Trader Reveals 10 Top Pattern Trades
Get Free Access to the Strategy Here!


As a pattern trader, I try to only look for patterns on stocks that are less susceptible to major shifts in the market.

Think BIG, BIG name-brand companies like…

Target, Costco, Boeing, IBM, Kohl’s, Coca-Cola, CVS, Mastercard, and Starbucks.

These mega-large, name-brand blue-chip stocks tend to behave very differently than other stocks.

For one thing:

  • They are not seasonal businesses.
  • Their sales are year-round.
  • They also rarely have a BAD quarter. On the contrary, their earnings usually rise every quarter like clockwork.

More importantly than that…

  • These companies have massive market caps, usually over $10 billion.
  • They have large, loyal brand followings.
  • They often have millions of shares available for purchase.
  • And they have a long history of strong performance.

As a pattern trader, this is exactly the kind of company I want to trade.

These stocks don’t just dive down in price because of a random Tweet. 

They aren’t as easily manipulated by the mob.

They’re more like massive cargo ships – slow, steady, and strong

It takes a heck of a ton of pressure to change their trajectory, even in volatile times.

Let’s take a look at one more:  Walmart (WMT).

Starting on Wednesday, September 15…

This stock is slated to go on a 20-day price hike, rising by an expected $1.95 a share until October 12…

How do I know this?

Because according to my own data, Walmart has repeated this same pattern, over this same 20-day window…

In nine out of the last 10 years.

That’s right. This stock has literally gone up every year, at the same time, for nine years.

Now, $1.95 may not seem like a big jump for a stock that’s trading for over $141 a share.

But remember, this isn’t about investing.

It’s about leveraging small yet predictable price moves using options

When you click on my video, I will detail my other stocks, like

  • Booking Holdings (BKNG) - 148% gain
  • United Parcel Service (UPS) - 112% gain
  • Eli Lilly & Co. (LLY) - 104% gain
  • Netflix (NFLX) - 121% gain

All of these trades are detailed in my video, so have a pen and paper ready to write down stock symbols and dates.

The Money Calendar

What you’re looking  at  below is the exact program I use to identify pricing patterns on the top 325 blue chips on the market…

It’s called the Money Calendar.


And it’s the same program I’ve used…

To identify all 10 pricing patterns I’ve shared with you today.

Now, I’ve been using the Money Calendar for years…

Because it works.

Conclusion

When you combine my proprietary methodology for scanning stocks with highly repeatable price moves over the same time periods, then you are stacking the odds in your favor.

The Money Calendar and real time stock alerts will keep you abreast of the next pattern trades that are likely to occur.

There’s far more to this program that you will learn about that I can’t cover in a chapter of an eBook.

Make sure to get the full story by clicking on the button below.

ABOUT THE AUTHOR

Author: Tom Gentile
Company: Power Profit Trades
Website: PowerProfitTrades.com
Services Offered: Trading Education, Trade Alerts, Newsletters
Markets Covered: Options, Stocks, Forex, Futures, Cryptocurrencies

Chapter
03

6 Secrets to Options Trading Success

By Mike Ryske, Netpicks.com

In working with thousands of traders over the years, I have learned some tricks of the trade that I want to share with you that can make a big difference in your trading results over time. Trading options can be difficult but following these 6 secrets below will help improve your trading results right away.

In today’s ever-changing markets, it’s more important than ever to make sure to become a disciplined trader. The 6 secrets below will help you achieve more consistent profits following a few simple steps.

Secret 1: Make sure you have a trading system in place before putting capital to work.

Talk to any successful trader and you will find that they have a detailed system in place that they follow on every trade. Trading options is no different. You must have a system in place telling you when to get in and when to get out before you ever put your hard-earned capital on the line.

There are many trading systems available in the marketplace that claim to give you an edge. The big key here is to have a system that prints entry, target, and stop points right on the charts for you in real time. You don’t want a system that requires a lot of discretionary decisions to be made.

You also want to use a system that works on all stocks and ETF’s. You don’t want to be limited to a few products. Trading a diversified list of products will make a huge difference in your returns. Markets change and you want a system that can adjust to those changes quickly. This is the only way you can stay disciplined to your system.

I use this example with traders all the time. Would you ever try to build a house without blueprints? It would be a long shot to do and have it turn out. Trading is no different. You must have the blueprints there to guide you on every trade. If you don’t, you are left taking trades with your fingers crossed hoping they work out. Using a trading system will put a methodology in place that you can trust when putting your hard-earned capital to work.

You can see from the screenshot below we have exact entry, target, and stop levels in place before we ever put our hard-earned money into a trade.

There are literally hundreds of different indicators and tools to build a trading system around. Over the years, we have tested many different approaches using different custom indicators. I have put together a list of the top 5 indicators I would recommend building a trading system around.

Top 5 Indicators To Build A System Around

  1. Keltner Channels
  2. Standard Deviation Channels
  3. 8 Period Exponential Moving Average
  4. 50 Period Exponential Moving Average
  5. Average True Range (ATR)

Secret 2: Weekly vs Monthly Options...Which should I trade?

When talking about stock options there are many common questions that come up. Which strike price should I trade? Should I buy or sell the options? Should I use weekly or monthly options? The reason these questions can be tricky is that there is no perfect answer that fits every situation. It all depends on your outlook and what you are looking to accomplish with that trade. Let’s talk about the different expiration cycles in more detail.

Over the past few years, weekly options have become very popular with traders because in most cases they provide a cheap way for the retail trader to get into a trade. These options expire every Friday, which means they are great products for traders looking for quick movement in the stock or ETF. With the cheaper price many traders view the weekly’s as safer trades.

However, are they always the best products to use?

When deciding whether we should use the weekly or monthly options, it depends on our outlook for the stock or ETF. If we are expecting a quick move within the next few days, then the weekly options will give us the most bang for our buck. This is because Gamma, or directional risk, is higher the closer we get to expiration (see chart below). As a result of the higher gamma in the weekly options, the price of those options will react quicker to movement in the stock. The key takeaway here is we will see more powerful moves as long as the move happens quick enough.

However, options are decaying assets which means the longer we hold them the more time value comes out. The weekly options will allow us to make money faster if we get a quick move in our favor. The problem here is if the trade takes longer than anticipated the time decay will hurt our position very quickly. The weekly options just don’t give us much margin for error. With this in mind, I recommend using more monthly options. Even though you will pay more when trading the monthly options, you are building a safety net just in case the trade doesn’t happen as quickly as anticipated. Our sweet spot is to look for options with between 20-40 days left to expiration.

Secret 3: Trade the In-The-Money Options

Buying Calls or Puts:

When buying a long call or put we need to make sure we have a strong opinion on which way the stock or ETF is headed in the near term. We have to keep in mind that whenever we buy an option the clock is ticking the second we decide to initiate the trade. This means not only do we need to be right on market direction, but the move needs to happen in our favor quick enough.

To combat some of the negative features of buying an option, we like to be very picky with the criteria that we use when selecting the call or put option. First, we don’t pick the option based on what we can afford like so many retail traders make the mistake of doing. In many cases, this will leave you with an out of the money option which has a very low probability of success. Instead, we like to trade the in the money options.

Our criteria has us going out 20-40 days until expiration and buying the call or put option that is 1-2 strikes in the money. This criterion is the same whether we are trading GOOGL, SPY, or C. By using the same criteria on all stocks and ETF’s, we can take much of the discretionary decisions out of the equation.

Buying Vertical Spreads:

When using a long vertical spread, we still need to have a strong opinion on which way the stock or ETF is heading in the near term. While the time decay is still going to be there like with a long call or put, the long vertical spread can limit the effect of the time decay slightly. We like to use the long vertical spread when we desire to be in a more conservative position. We are able to do this because a long spread is constructed by both buying an option and selling an option with a different strike price at the same time.

Vertical spreads offer a unique ability to control risk and reward by allowing us to determine our maximum gain, maximum loss, break-even price, maximum return on capital, and the odds of having a winning trade, all at the time we open a position.

When setting up a long vertical spread, we still like to trade the options that have between 20-40 days left until expiration. We structure the trade by always buying the option that is 1 strike in the money and then selling the strike that is closest to our target for that stock or ETF in the near term. The nice part about using this simple criterion is that it is the same when using call or put options. The criteria are also the same regardless of the symbol of the stock we are trading.

So why wouldn’t we trade a spread on every trade?

While it’s great that vertical spreads limit the risk, they also limit the profit potential at the same time. Our profit is limited to the difference between the strike prices minus what we paid for the trade.

For example, if we are putting on the long 25/30 call spread that would have us buying the 25 call and then selling the 30 call. This leaves us with a $5 wide call spread. If we paid $2.00 for the spread our maximum profit potential would be $3.00. This is calculated by taking the $5 difference between the strikes and subtracting the $2.00 price that we paid for the spread.

Many newer traders get intimidated by trading spreads because they think they will be left with huge risk. However, the long vertical spread is safer than buying an outright call or put. The reason for this is that we can never lose more than what we paid for the vertical spread. It is a defined risk trade. This is because we are buying the option that is one strike in the money and at the same time offsetting some of that cost by selling the option that is farther out of the money. As a result, we can lower the overall cost of the trade.

The long vertical spread is one of my favorite trade types and should be a part of your overall options toolbox.

Secret 4: Risk Management - Position Sizing

One of the biggest reasons for traders failing to reach their trading goals is trading positions that are way too big for their account size. I hear it all the time from newer students, “If I just hit a few big winners the whole game changes for me.” This approach is completely backwards thinking. When trading with a small account size, it’s crucial to focus on consistent growth over time. If you can focus on small winners on a regular basis, you will see the power of compounding take over.

I would also much rather see a newer trader take 5-6 small positions instead of 1-2 big positions. With any trading system, the statistics become more significant as the sample set of trades becomes larger. If you are just taking 1 or 2 trades at a time, it becomes a long shot to see the results you are looking for. However, if you are taking 5-6 trades you can get more diversification built in and also build our sample set of trades larger to make sure the odds are in our favor.

Having a risk management rule in place is crucial to trading success. I have included a sample risk management template below:

Sample Risk Template:

Determine what % of your account size you are willing to have at risk.

In my plan I use the 50% number. This rule says I will not have more than 50% of my account size at risk at any one time. If I am using a $50,000 account this means I can’t have more than $25,000 at risk across all my different positions. I would have $25,000 to work with spread across my watch list. If I reach that $25,000 limit and I get new trades to set up, then I need to either close out of some existing trades to free up capital to get back below the $25,000 level or skip the trade.

The 50% number works for me and is a level I am comfortable with. That number could be different for you. It could be 25% or 60%. The number doesn’t matter to me asong as you are comfortable with that level of risk and it’s something you can stay disciplined to follow.

Secret 5: Have a small universe of stocks/ETF’s that you look at on a regular basis

The most overwhelming issue that comes up for a trader daily is how to find the best trades for that day or week. There are thousands of stocks and ETF’s out there that you can trade every day. Instead of scanning this big list of products daily, we recommend narrowing the universe of products down to a smaller list that we can get to know well. This way I can easily determine whether I am bullish, bearish, or neutral without spending a ton of time each day staring at the charts.

We recommend re-evaluating your watch list one a month. If you do it too often, you run the risk of chasing performance. Instead, we would rather stay consistent with a small, diversified watch list of programs. Below, I have outlined a sample watch list of 30 products which would be ideal for an account size in the $10,000 - $20,000 range.

Sample Watch List

-Using a combination of directional trades along with credit spreads.

-Account Size: $10,000 - $20,000

Short Premium Trades:

-3-7 credit spreads. These trades can come from any stock or ETF on our list of 130 trade plans.

Secret 6: Keeping a Trade Journal

Many successful traders talk about how important it is to keep a trade log. I like the term 'Trade Journal' much better. When I think about keeping a trade log, it typically just requires you to document where you got in and out of each trade. Keeping an actual trade journal is more detailed. Documenting each trade that you take is crucial in any type of trading. However, I also like to keep detailed notes on each trade to keep track of more statistics than just entry and exit points.

Some of the data that I like to track are things like:

  • Entry date
  • Exit date
  • Entry Point
  • Exit Point
  • P/L
  • Average holding time
  • Types of trades (if your system has multiple trade types)
  • Levels of implied volatility (for options traders)

I then take it a step further and document any key notes or important events that happened during the trade. Some of the notes that I like to track are below:

  • Any big news events and how they affected the trade (FOMC statement, earnings, employment report)
  • Any holidays that could cause unusual market movement
  • How did I execute my trade plan?

All these notes can make an impact on my trading long term. For example, if I want to know how the market reacts to different holidays throughout the year, then I will want to document key statistics around those holidays. I track volume numbers and ranges for those holiday sessions so I can go back in time to see what the historical results have been. The same is true for how I track any big news events like an FOMC statement on interest rates or an employment report that are released.

I also evaluate the execution of my trade plans on a regular basis. A trade plan is only powerful if you stick to it and follow it religiously. I can’t tell you how many times I have had to learn hard lessons when not following the trade plan. I keep track of all discretionary decisions when I’m trading to make sure all decisions are backed up with statistics. For example, if the numbers don’t back up trading between the Christmas and New Year’s holidays then I won’t take any trades.

How do I keep my trade journal? There are multiple parts of the journal. First, I log every trade with the statistics listed above. This can be done in a simple excel spreadsheet, a google doc, or even just handwriting things in a notebook.

You will want to make sure you document every trade that you take. While it seems like a lot of work, it only takes a few minutes each day. Think about any other business out there and you will see that it’s important to track your numbers to gauge the performance of the business. Trading is no different. Just because we don't have a boss looking over our shoulder holding us accountable doesn't mean we can get lazy and not track our results in a detailed manner.

The second part of my trade journal is done by me taking notes on a daily/weekly basis. The last few years I have used a simple google doc for this process. I take note of any big events that affected my trades, along with how I executed my trade plan. The key here is to give an honest assessment of your performance. The only way you will be able to learn over time is if you are hard on yourself. If you make a mistake, take note of it so that mistake is not repeated down the road.

Like any journal, the only way you can benefit from this record keeping is to review it on a regular basis. Take a day each week or month and go to the local coffee shop to review your journal. Take note of areas that are working/not working and adjust when needed. This will give you a plan of attack going forward of things that need to be improved on.

Conclusion

There is more opportunity in the markets than ever before. However, we also see many retail traders making the same mistakes that are holding them back from being consistently profitable. The 6 Secrets To Options Trading Success was put together to help you avoid these common road blocks. If you follow these simple steps, you will be well on your way to more profitable trading.

THE SPECIAL OFFER

Learn How You Can Start Trading Our "Overnight Pop Trades"

Trade Today - Exit Tomorrow

Our Quickest Options Trading Alerts

ABOUT THE AUTHOR


Author: Mike Ryske, Director of Options Education
Company: Netpicks
Website: Netpicks.com
Services Offered: Trading Systems and Education for Options, Futures and ETFs 

Chapter
04

How to Trade Market Geometry: The Science of Price Action

By Richard Krugel, PriceActionAndIncome.com

Are you sick of second-guessing your analysis? Or worse, putting in the hard work and following your strategy rules only to see your trades crash and burn before they reach your targets?
 
When most traders start out, they tend to believe that the more indicators they use the better their performance will be…

But this couldn’t be further from the truth!
 
Instead, a better place to start is to understand how markets move on a chart and WHY – without any indicators.

So even though price action might seem random…

Once you unlock the power of Market Geometry, it becomes possible to make sense of what’s really happening on your chart...

Which can help you spot massive profit opportunities every week, every month, and every year!


THE SPECIAL OFFER

Market Geometry Toolbox

The Market Geometry Toolbox is like a “greatest hits” collection of trading tools.

It’s a complete package for analyzing the markets just like I do, and it includes every analytical tool I use to trade the markets, all pre-loaded with my custom settings and exact specifications for using them effectively to find massive opportunities in any freely traded market.

ABOUT THE AUTHOR


Author: Richard Krugel
Company: Price Action & Income
Website: priceactionandincome.com
Services Offered:Training Courses and Trade Alerts
Markets Covered: Forex. Futures, Options

"I'm taking everything i learned on the chicago Board Options Exchange and finding the BEST trade idea for you every single week. Now it's your turn to FINALLY get the edge."

When you grab your 5 trades for only 5 bucks… you’ll also get a 4-week subscription to our flagship newsletter where you’ll get access to:

  • 5 High-Conviction Trade Ideas – Plus Our Research – Over the Next Month
  • The “Options for Dummies 101” Tutorial (Value: $99)
  • Bonus Training Video: How to Make Up to 3,700% With the Legged Spread (Value: $199)
  • The Eight-Part Video Training Series Wall Street’s Most Treasured Secrets UNCOVERED! (Value: $899)
  • And So Much More!
Click Here to Grab 5 Trades for Only 5 Bucks

Chapter
05

My Favorite Trading Strategy Indicators

By Dave Mabe, Trade-Ideas.com

Clean Charts


Too many trading indicators on a chart is a sign of mediocrity. Your charts should be nice and clean showing you exactly what you need to see to make your pre- planned decisions and no more.
 

Many traders take this to heart and have simple charts that aren’t littered with indicators, but too many draw the wrong conclusion at this point: that all indicators are worthless. A trader’s clean chart is not recognition that all indicators are garbage – it should represent that the trader has gone through the thorough and painstaking work of determining which indicators are most important to their trading and why. It should represent countless ideas of what indicators make their trading tick and lots of decisions about the trade offs of including or excluding certain ones. A simple chart should represent the quantifiable tests that have gone into determining which indicators contribute to profit.

Traders spend a lot of time focusing on the event that occurs to initiate a trade (for example, a new high). In Trade-Ideas we call these Alerts. What traders quickly realize, though, is that the filters you use to determine which new highs to actually trade and which ones to ignore is the most important part of a trading strategy.

A lot traders trade stocks that reach new highs, but nobody trades ALL of them. Most of your time will be determining under which circumstances you take the trade and which ones you skip. This is the meat of your trading strategy and where you should spend the vast majority of your research time.

If you had to choose just one thing to improve in your trading process, it should be your routine for selecting filters. Improving your skills in filtering will compound over time and you’ll become better and better the more you do it. Your routine will become more efficient and you’ll quickly be able to get from a rough trading idea to an actual strategy that you’re ready to risk money with.


Indicators Used in Every Strategy I Trade

I have a consistent routine for evaluating and improving trading strategies. The most important part of this routine and where I think most of my personal edge as a trader comes from is determining which indicators to use in a strategy.

If you look across every strategy I’ve ever traded you’ll see lots of different indicators in use. You’ll also see some of the same ones appearing in a lot of them  – some appear in every single one. Here’s the list of indicators (a.k.a. filters) most commonly appear in my strategies. When improving my models, these are the ones I look at first.

Volatility

Although some treat it as a generic term for movement, volatility has a very specific meaning at Trade-Ideas. It’s the amount the stock typically moves in a 15 minute period. Does it really matter what a stock does on a NORMAL day when strategies are typically looking for ABNORMAL activity? It turns out it has a big effect. Unusual activity with a stock eventually reverts back to its normal behavior and sometimes that can happen quickly. You’ll find that stocks that move more on normal days also move more on unusual days. If movement is what you’re looking for you should be looking at Volatility.

Take the two charts below. At first glance these charts seem pretty similar, but when you look at Volatility, Novavax (NVAX) simply moves significantly more than ZTO Express (ZTO).


Relative Volume

Relative Volume is perhaps the most important filter of them all. Let’s say two stocks have traded a million shares so far today. If stock A normally trades 200,000 shares at this point in the day but stock B typically has traded 5,000,000 shares, the stock A has a lot more interest from market participants than stock B, relative to what it normally trades. This is, of course, critically important to your trading system.

For stock A a continuation strategy probably makes perfect sense given the volume is unusually large, but for stock B the same amount of volume is unusually small. These are two completely different situations even though the shares traded is equal for the day for these two stocks. The value for Relative Volume alone could be the determining factor for choosing the direction you want to trade a stock.

Take the two charts below. They both have almost the same shares traded for the same day, but the relative volume for BNTX is 0.8 while the relative volume for SKYS is 24. The calculation for Relative Volume at Trade-Ideas is perfect because it is aware of how many shares a stock trades throughout the day. For example, if a stock has an average daily volume of 500,000 shares and by 9:45am it’s already traded 400,000 shares, the Relative Volume value recognizes that this is more significant that if the stock reaches 400,000 shares at 3:45pm. You can read more about exactly how this indicator works here.


Gap %

A lot of traders trade gapping stocks (including me). Stocks that have potential for movement have very often gapped up or down at the open. But not all gaps are equal. Take this gap in TSLA yesterday (Top Image). It’s over $18 but you hardly even notice it on the chart.

But then take a look at this gap in EVFM (Bottom Image). It’s less than $2 but very significant when you look at the Gap percent.

I’ve backtested gaps for a long time and the value that keeps popping up as a good one to use as a starting point is 3.5 percent. When looking for gaps up, I start with a minimum Gap Percent of 3.5 and when looking for gaps down I use -3.5.


Average True Range (ATR)

The Average True Range (ATR) of a stock has a very specific definition. Like Volatility above, it captures typical price movement. So why do I have two indicators for price movement? They are highly correlated, so surely we can just choose one and simplify things, right?

“All things equal, stock movement due to recent earnings is more significant than movement for other reasons.”

It turns out there is a subtle difference between the two measures that is quite important for trading systems.

The Average True Range is measuring the daily movement of a stock, while the Volatility is measuring the average movement during a 15 minute period. These numbers are highly correlated, but you do see stocks that have higher or lower volatility numbers relative to their ATRs and vice versa.

All things equal, the Average True Range will be a better indicator when applied to a trend type strategy where you’re holding a lot of the day or overnight. The Volatility indicator will be better when you’re trying to capture a shorter move on an intraday timeframe. I always look at both of these indicators when designing strategies. I’d encourage you to look closely at the definitions and understand what both of them represent.

Earnings Date

There are a lot of news items that can move a stock: upgrades, downgrades, share offerings, splits, etc. None are more consistently important than earnings announcements. Both investors and technical traders are focused on earnings so it’s bound to have an impact on your trading system. All things equal, stock movement due to recent earnings is more significant than movement for other reasons.

Trade-Ideas has a fantastic way to filter on Earnings Dates. I use it to determine which stocks are moving due to earnings and which ones are not. I also have scans that show me stocks that are reporting earnings after the close or the next morning.

Volume Leaders Just Reported


Volume Leaders Reporting Soon

Here’s the cloud link for the Volume Leaders Reporting Soon top list I use and for the Volume Leaders Just Reported top list.

Position in Range

A stock’s position in its recent range has a huge impact on its future movement. Take a look at Morgan Stanley (MS). (Left Image) It gapped up above its recent range. But look at SL Green Realty Corp (SLG). (Right Image)

These are comparable gaps, but these stocks are in very different situations. MS gapped up well above its recent range but SLG is still very much at the bottom of its recent range. The recent trading range is very important to a stock’s future price movement and I always look at the Position in Range indicator when evaluating my trading systems. The time period for the range will vary based on the timeframe for your system. For an intraday trading system you should start with the position in today’s range but for longer term systems the position in yearly range might be more appropriate.

While I don’t use all these filters in each strategy I trade, these are definitely the ones I examine first when researching a new strategy. What are your go to indicators for your trading systems?

THE SPECIAL OFFER

Trade of the Week

Sign up below for a new Trade of the Week every week. You'll get the chart and our reasoning behind the trade.

ABOUT THE AUTHOR


Authors: Dave Mabe
Company: Trade Ideas LLC
Website: Trade-Ideas.com
Services Offered: Live Streaming Trading Ideas Powered by Artificial Intelligence
Markets Covered: U.S. and Canadian Equities

Chapter
06

Identifying Big Breakout Moves Before they happen

By Stephen Bigalow, CandlestickForum.com

How can you anticipate a big breakout move? That is the question of most investors. Candlestick analysis produces indications of when prices are ‘about’ to explode. Simple scanning techniques produce high probability results.

Are you missing the big price moves? Does it seem like everybody else gets in big profit trades and you are not? If you learn the reoccurring investor sentiment patterns, you gain a huge advantage for knowing when a big breakout price move is about to occur.

Candlestick analysis provides indicators that identify set ups for breakout trades.  Knowing that investor sentiment works the same way time after time it becomes easy to recognize high probability trades set ups before a breakout occurs. You will know exactly which trades will produce continued profits as they are occurring.

Knowing the appropriate entry points and the correct trading strategies i.e. stock, options, option spreads, allows investors to trade with confidence versus guessing what the next price movement will be. Candlestick formations make identifying price move results very easy.

You can expect high probability results!  If you are an option trader, this information will be hugely valuable!

Imagine having the ability to identify when a big price breakout move is about to occur. And then knowing the exact option strategy to apply. Simple entry strategies will put you into profitable trades with an extremely high degree of accuracy.

Candlestick analysis produces a huge visual advantage for quickly calculating the risk/reward of a trade. This is due to a very simple premise. Expectations! You gain  a constant source of high-probability profitable day trades set ups. This is exactly what candlestick analysis provides!

Candlestick signals and patterns reveal high probability price movements based upon human nature. Investor sentiment is the most consistent trend analytical tool in history. Prices move the same way time after time due to the reoccurring investment perceptions of human nature.

This information dramatically improves an investors capability to analyze the risk and reward of a signal/pattern price move expectation. The candlestick investor can quickly evaluate when a pattern breakout is likely to occur. Pattern breakouts produce strong profit potential moves. The prophet gain can be easily assessed based upon simple visual targets. At the same time, stop losses can be placed at trading levels that would indicate when the pattern breakout did not perform.

There are approximately eight good strong high probability patterns breakouts. But

there are two patterns that produce extremely high probability results, the Fry Pan Bottom breakout and the Bobble breakout pattern.

The Fry Pan Bottom

The Fry Pan bottom is easily recognized by simple visual analysis. It is a slow rounding bottoming action, which usually cannot be traded one way or the other, until it reaches the level where the pattern began. This becomes a very high probability entry point. As illustrated in the AMED chart, the breakout occurred with a strong candlestick signal, the Best Friend signal (a Doji followed by a gap up). Candlestick signals greatly enhance the confirmation of a Fry Pan Bottom breakout.

A Fry Pan Bottom is a visually recognizable trades set up. It is the obvious buildup of bullish investor sentiment. It looks like a fry pan bottom. Like all candlestick patterns, it has multiple benefits. First, it can be easily identified by its slow rounding trajectory, alerting investors of a potential big price move. Secondly, the breakout level is easily identified, using occurring where the pattern started. Finally, when a fry pan bottom breakout occurs, it will usually produce excessively strong profitability.

Most investors hesitate to chase a price move. But candlestick pattern breakouts allow investors to participate in big price moves with immediate confidence. This is from having the knowledge of knowing what will usually occur after a candlestick pattern breakout.

A Fry Pan Bottom breakout produces high probability expectations of a big price move. The qualifying word “probability” has to be applied to all investment analysis. Although a large percentage of Fry Pan Bottom breakouts perform as expected, successful investing involves knowing when a trade is not working.

The visual analysis of candlestick charts produces a very effective risk/reward analysis. What should a price be doing after a candlestick pattern breakout? Moving in the expected direction! Where should the price not be trading?

The DVAX chart shows the simple logic incorporated into candlestick analysis. A Fry Pan Bottom breakout at the resistance level becomes the ultimate entry point (1). As it moves up through that level, what is expected? A strong upside move. What becomes the logical level to place a stop to minimize risk? At the same level where the price broke out into new territory. Logic reveals that if the price came back down through that level, what did it illustrate as far as a breakout? It did not breakout.

OR if the trade was not closed out after the failure to breakout, what was required to stay in the trade the next day? A positive open and positive trading! A lower open would have immediately stopped out the trade.

The J-hook pattern/Bobble breakout

Another extremely high pattern breakout is produced by a J-hook pattern. The Bobble breakout is merely a much more defined pattern breakout. A Bobble breakout has higher probabilities of moving in the correct direction because it is utilizing a technical level, such as a moving average, that everybody else is watching.

Knowing what to expect from a Bobble breakout makes for a very easy risk/reward assessment. A J-hook pattern has an aspect that makes it easy to calculate what the upside potential of a move will be. Wave one will usually be the same magnitude as wave three.

The Bobble breakout is merely a J-hook pattern that has resisted at a moving average and then created a J-hook pattern, moving back up through the resistance level. The reason the Bobble pattern has enhanced strength is because investors watching to see what is occurring at the potential resistance level start buying when they see the resistance level is not acting as resistance anymore.

The candlestick investor, recognizing a Bobble pattern set up, can be establishing trades well before the rest of the investment community starts piling in. The upside potential can be calculated and the downside risk can be immediately assessed.

Bobble Breakout

The SBLK chart illustrates a bobble breakout pattern. Note how wave 1 failed right at a resistance level, that everybody would be observing, the 50 day moving average. The pullback, wave 2, supported at the T line. (The T line is a highly effective trend indicator that demonstrates the natural support and resistance level of human nature.)

The entry for a Bobble breakout is when it starts trading above the resistance level. The candlestick investor has the ability to recognize the Bobble breakout, a J-hook pattern that is more defined using the 50-day moving average as the breakout level, knowing wave 3 will likely produce the same magnitude move as wave 1.

Entering the trade above the 50-day moving average produces an extremely high probability wave 3 is now in progress, entering the position well before everybody else who is watching what is occurring at the breakout level. The strength of the following move is based upon the confidence of other investors seeing that the 50-day moving average is not acting as resistance anymore.

A J-hook pattern has high probability results. A bobble breakout has better probability results. The candlestick investor can identify the potential bobble breakout by witnessing support at the T line. The T line demonstrates the natural support and resistance level of human nature. This prepares the candlestick investor for watching what will happen at the previous resistance level, a technical level that everybody else is watching. A push back up through that technical level creates the bobble breakout which gains much more force from all other investors that are watching to see if it will breakout through that level and start piling in.

Expectation? Strong upside potential of wave 3. Risk factor? A close below the resistance level/moving average a second time would indicate the breakout did not occur, the position would be closed immediately.

Every money manager advises investors to cut their losses short and let their profits run. Unfortunately, they never explain how to cut your losses short and let your profits run. The simple common-sense rules applied to candlestick analysis makes it very easy to know when to stay in a trade and when to immediately close out a trade.

The application of simple risk/reward analysis is based upon the candlestick charts showing when a trade is working and when it is not working. You gain valuable insights knowing what to expect based upon high probability candlestick patterns.

If you are struggling with figuring out the risk rewards of a trade set up, the simple logic built into candlestick analysis will dramatically improve your abilities to recognize strong price move potential and what your risk factor will be.

This information dramatically improves an investors capability to analyze the risk and reward of a signal/pattern price move expectation. The candlestick investor can quickly evaluate when a pattern breakout is likely to occur. Pattern breakouts produce strong profit potential moves. The prophet gain can be easily assessed based upon simple visual targets. At the same time, stop losses can be placed at trading levels that would indicate when the pattern breakout did not perform.

Common sense trading perspectives are built into candlestick signals. You will gain a completely different perspective on how to trade successfully. Candlestick signals and patterns reveal high probability price movements based upon human nature. Investor sentiment is the most consistent trend analytical tool in history. Prices move the same way time after time due to the reoccurring investment perceptions of human nature.

THE SPECIAL OFFER

What if a trading system existed that allowed you to gain a clear 'unfair advantage'....where you are able to anticipate each and every market move? Well, you're about to discover that exact system in a revealing video on my Unfair Advantage video 

ABOUT THE AUTHOR


Author: Stephen Bigalow
Company: Candlestick Forum
WebsiteCandestickForum.com
Services Offered: Trading Education, Books, Videos, Webinars, Indicators, Live Trading Room
Markets Covered: Options, Stocks, Forex, Futures

Get My 10 Trading Patterns Absolutely FREE!!

If you’re looking for a proven, far more effective way to grow wealth, then...

Watch This Video Now

Chapter
07

How to Trade Butterflies to Beat Any Market

By Larry Gaines, PowerCycleTrading.com

Butterflies provide a low risk high reward trading opportunity. Markets direction can go through months, and even years of higher than usual uncertainty. Technical analysis may be painting one picture, while the economic or political environment is painting another. This can be both stressful and costly. The Butterfly strategy offers a solution to this dilemma that all traders face on a regular basis. 

While there’s always some degree of uncertainty that traders and investors must accept, there can be long frustrating periods of higher than usual conflicting signals. This increases risk for traders and investors. Yet, waiting on the sidelines has opportunity costs. For traders who have come to rely on regular income from trading, loss of that income can cause serious lifestyle problems. These situations call for a strategy that will work no matter which direction the market heads.

That’s exactly what the highly versatile Butterfly strategy does. It gives you a trading advantage in any type of market environment. This makes it a powerful strategy that every serious trader will want to add to their arsenal of skills.

Many traders know of the advantages of the Butterfly, yet they may have avoided it because of its complexity. Initially, the setup can seem overly complicated. This is because most traders try to master the Butterfly without truly understanding a few basic option trading principles first.

In this presentation, I’m going to simplify the Butterfly for you. The reality is that once you grasp these basic concepts, you’ll see that the Butterfly is just marrying a couple of simple setups that you probably already know. Serious traders take the time to master the skills to increase their returns while lowering their risk. The Butterfly is one powerful way to do that. Since many traders avoid the Butterfly, by taking time to master it is going to give you a powerful edge up on traders who continue to avoid it.

Here is what you’ll learn

  1. Best Market Conditions for Butterflies
  2. Benefits of Butterflies
  3. The Option Greeks You Need to Know First
  4. The Most Important Option Factor         
  5. The Butterfly Setup

I. Best Market Conditions for Butterflies

Unlike other option strategies such as iron condors, credit spreads, or debit spreads that only work with an identified objective based on probable market direction, Butterflies can be set up and traded for a variety of objectives based on where a trader thinks the security or market is headed, as outlined below. One of the best things about Butterflies is that they are ideal regardless of market direction!

1. You Just Don’t Have Any Idea Where the Market is Headed

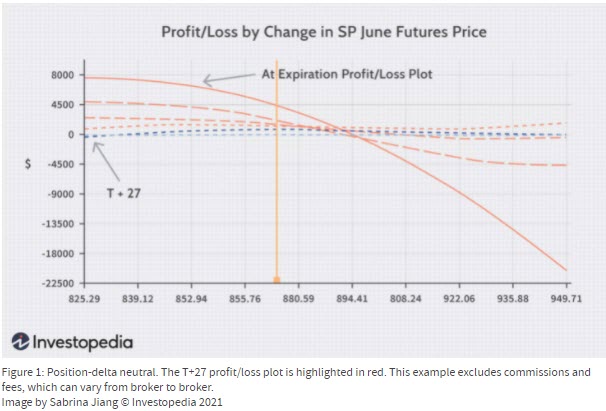
Non-Directional – Here’s the real beauty of the Butterfly! In their simplest form, butterflies can be delta neutral or non-directional trades. This means they can be used successfully when you simply DO NOT KNOW the market direction. Trying to pick the direction of stocks or the overall market can be stressful and expensive. Delta neutral butterflies can be set up to take the guesswork out of trading.

2. You Feel Pretty Sure the Market Is Headed Up or Down

Directional – The Directional Butterfly Spread can also be used for bullish or bearish exposure to the market while also managing risk and retaining large potential returns.

There’s no such thing as a free lunch: Butterfly spreads cannot offer unlimited profit potential. But they usually cost less than buying options outright while providing a powerful positive risk reward trade set-up that simply cannot be found with other trading strategies. 

3. You Don’t Want to Lose Your Shirt!

Hedging – The Directional Butterfly can be used as a fast to execute hedge on positions that are moving against you. This is exactly what the most sophisticated companies do. They hedge, and so can individual traders! Note: This lowers trading stress!

Constructing a butterfly around a strike that is under pressure from another core trade (such as a credit spread, or debit spread) controls risk.

This allows you to keep the original position open, buying time. Often, additional time is all that’s needed for a trade to move back to profit territory. At that point you can then remove the butterfly hedge and stick with your original trade.

Butterflies provide cheap protection! Many longer-term investors and swing traders buy puts for portfolio insurance. Long term out-of-the-money put butterflies, however, can be a much cheaper method of portfolio protection than pure long puts.

II. Benefits of Butterflies:

Income - Butterflies can be used to generate income from stocks that appear to be going nowhere in the short term. This alleviates overall portfolio returns in flat markets.

Low Cost - Butterflies can best structured and traded at a very low cost.

Risk Reward - A 10-to-1 or higher Reward-to-Risk is common. This fantastic risk reward ratio makes them well worth the effort to learn the structure.

Low Maintenance – Butterflies are sometimes called “vacation trades” due to their low risk and need for only very infrequent monitoring.

  • Butterfly trades are generally very slow moving early on in the trade.
  • But get more exciting and volatile as they approach expiration and are within the profit tent (Zone).

III. The Option Greeks You Need to Know First

The "Greeks" provide a way to measure the sensitivity of an option's price to quantifiable factors. The Greeks are strictly theoretical. That means the values are projected based on mathematical models and all of the best commercial options-analysis packages will do this, and on some of the better brokerage sites they are free.

Brief Review of the Greeks

Theta – (decay movement) measures your time decay (per day) – increases each day as it gets nearer EXP. & at zero at EXP.

Implied Volatility – (price movement) what the marketplace is “implying” the volatility of a stock will be in the future & its effect on where price will be

Delta – (price movement) measures the change per $1 change in the underlying & a measure of price probability

Vega – (volatility movement) measures the change per 1% change in volatility, decreases each day & at zero at EXP.

Gamma – (price movement) is the rate of acceleration of delta based on a $1 change in the underlying – most at risk & largest impact last week of EXP.

IV. The Most Important Option Factor

The most important option factor for profit generation using the Butterfly Strategy comes down to understanding the concept of TIME, and its effect on the price of an option…

Time Value ~ is used for trading strategies that take advantage of the accelerated Time Decay of an option into its Expiration. Butterfly Strategies are tied to Time Value (Theta) & the impact it has on the price of an option.

What exactly is Time Value?

Time value (TV) (extrinsic) of an option is the premium a rational investor would pay over its current exercise value (intrinsic value), based on its potential to increase in value before expiring. This probability is always greater than zero, thus an option is always worth more than its current exercise value. The change in the value of an option, based on Time Decay, can be measured using the Greek, Theta…

Option Theta

Theta tells you how much an option’s price will diminish over time, which is the rate of time decay of a stock’s option.

Time decay occurs because the extrinsic value, or the Time Value, of options diminishes as expiration draws nearer.

By expiration, options have no extrinsic value and all Out of the Money (OTM) Option expire worthless.

The rate of this daily decay all the way up to its expiration is estimated by the Options Theta Value.

Understanding Option Theta is extremely important for the application of option strategies that seeks to profit from time decay. 

Options Theta – Characteristics

Option Theta values are either positive or negative.

All long stock option positions have negative Theta values, which indicates that they lose value as expiration draws nearer.

All short stock option positions have positive Theta values, which indicates that the position is gaining value as expiration draws nearer. 

Theta value is highest for At the Money (ATM) Options

And progressively lower for In-The Money (ITM) and Out-of-The Money (OTM) options.

ITM and OTM options have much lower extrinsic values, giving little left to the decay.

For Example:

An option contract with Option Theta of -0.10 will lose $10 per contract every day even on weekends and market holidays.

The buyer/holder of an option contract over a 3-day long weekend with a price of $1.40 or $140 per option contract and an option theta of -.10 will find the price of that option at $110 instead of $140 after the 3-day weekend.

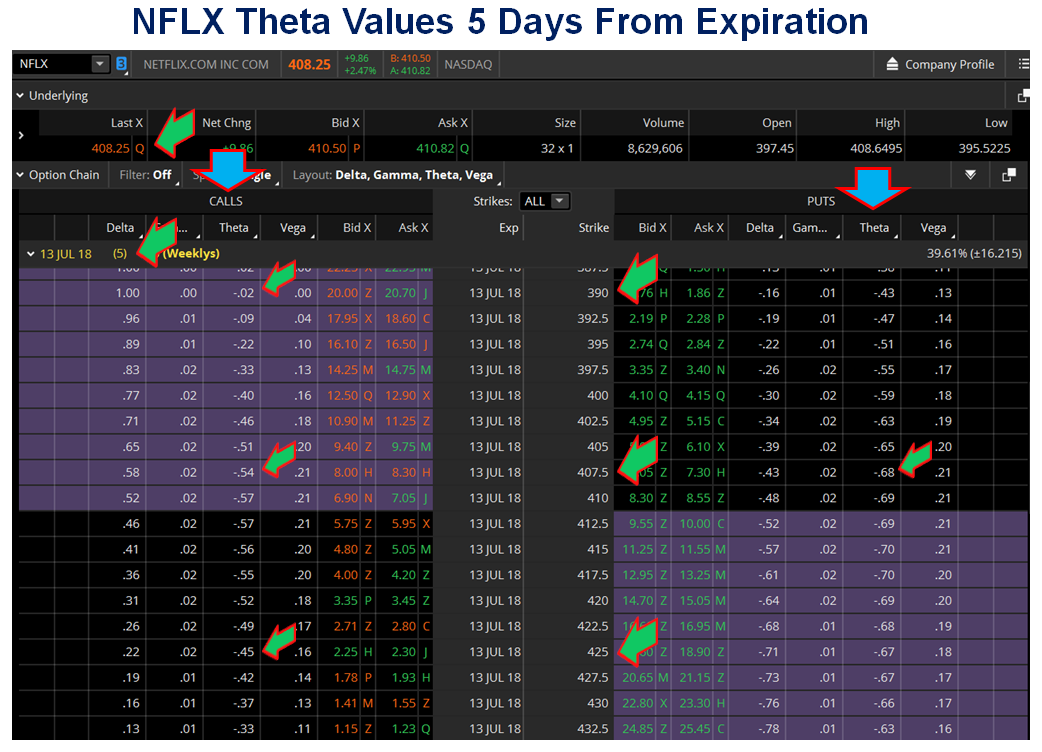
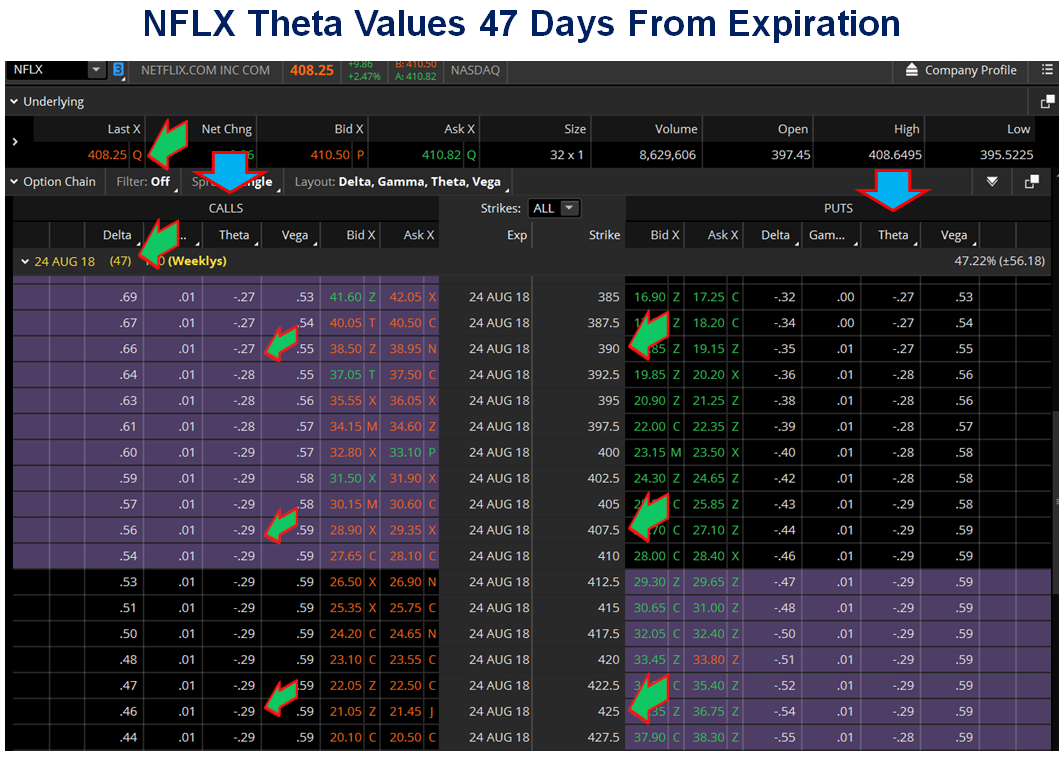
Theta Decay Strikes!

Option theta does not remain stagnant.

It increases as expiration draws nearer and decreases as the options go more and more In-The-Money or Out-of-The Money.

In fact, the effects of Option Theta decay are most pronounced during the final 30 days to expiration where theta soars. 

Take a look at the following chart to see just how predictable and powerful this option paradigm is!

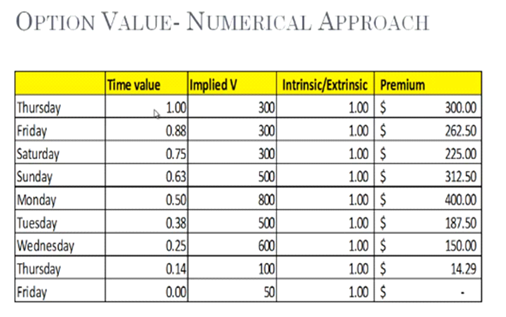
How Option Pricing Works

How to value an option

Time Value (x) Implied Volatility (x) Intrinsic/Extrinsic Value

Note: Once you know these variables then you are ready to price an option & know what its option premium should be.

V. The Butterfly Setup

Butterfly Foundation: Vertical Debit & Vertical Credit Spread

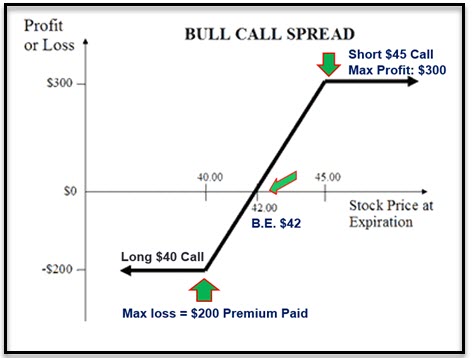
Vertical Debit Spread:

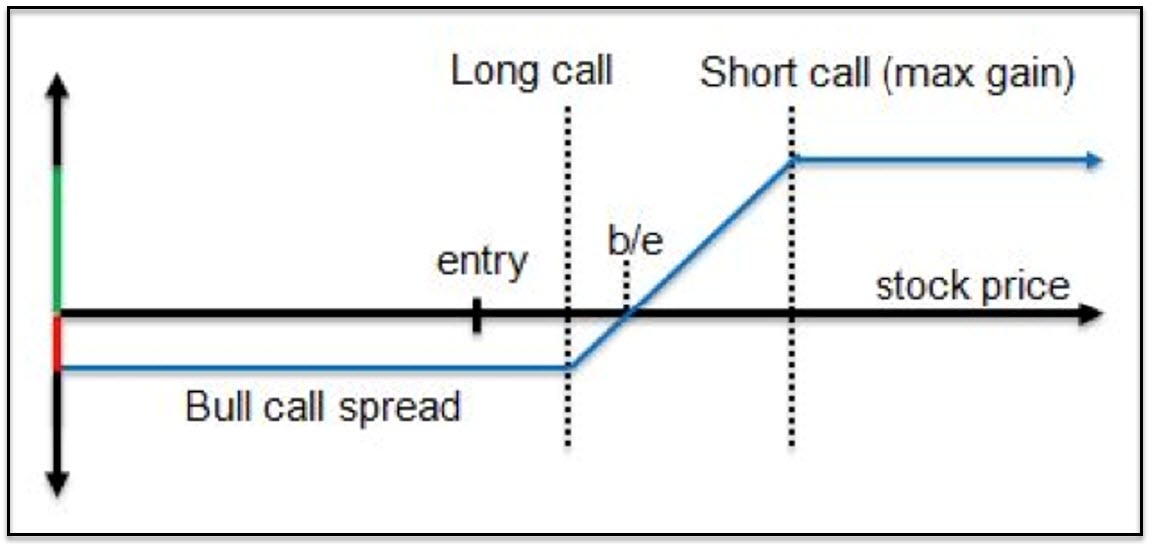
A “bull call” spread, entails buying one call and selling a higher-strike call that will be lower in price to offset some of the premium cost & theta decay

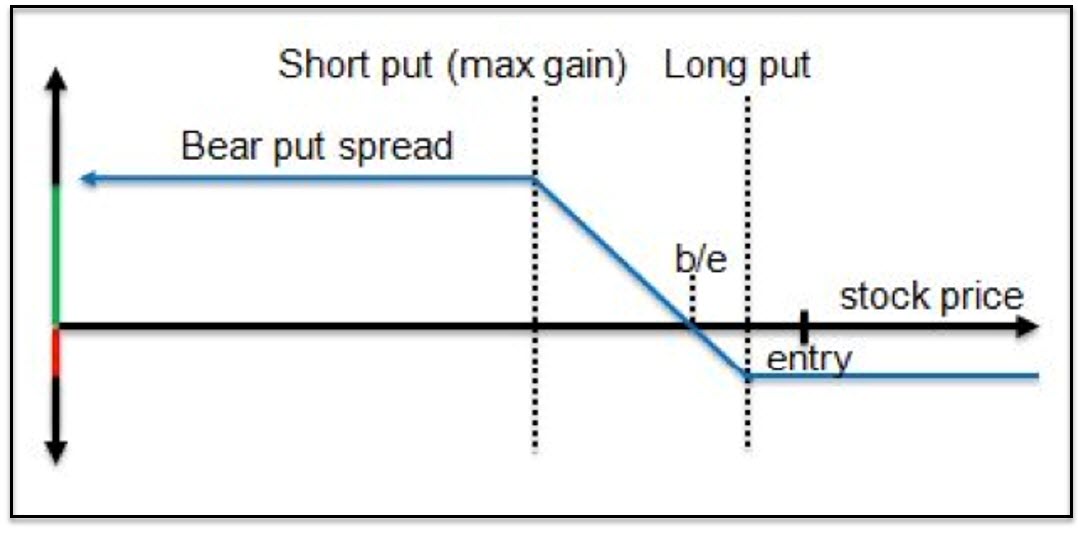
A “bear put” spread entails buying one put and selling a lower strike put, that will be lower in price to offset some of the premium cost & theta decay

These spreads are done for a debit

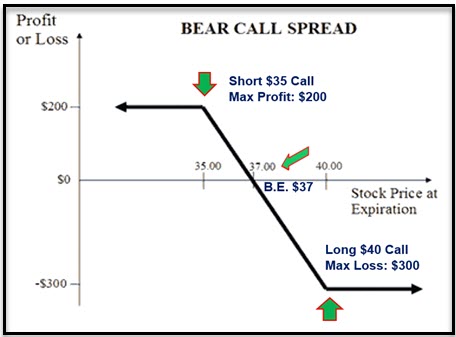
Vertical Credit Spread:
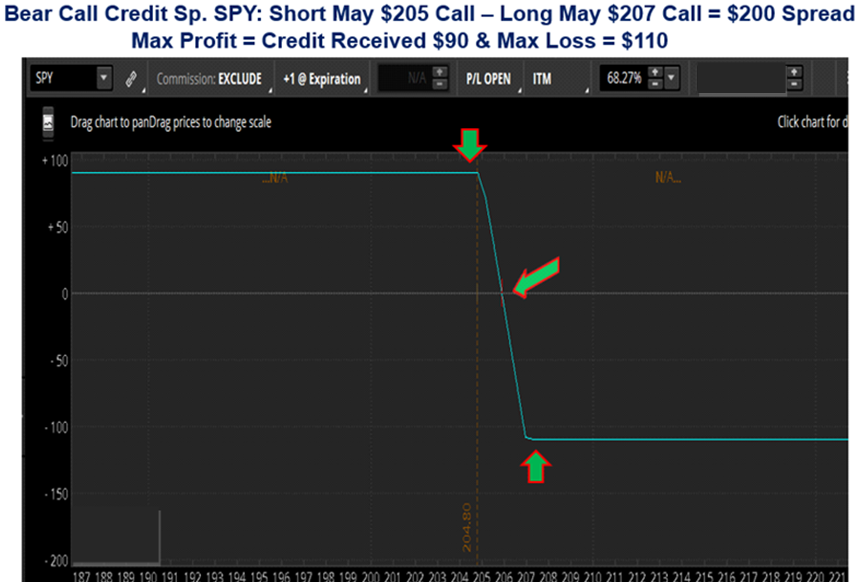
A “bear call” spreadentails selling one call and buying a higher-strike call that will be higher in price to hedge the short call.  Premium collection.

A “bull put” spread, entails selling one put and buying a lower strike put that will be lower in price to hedge the short put.  Premium collection.

These spreads are done for a credit

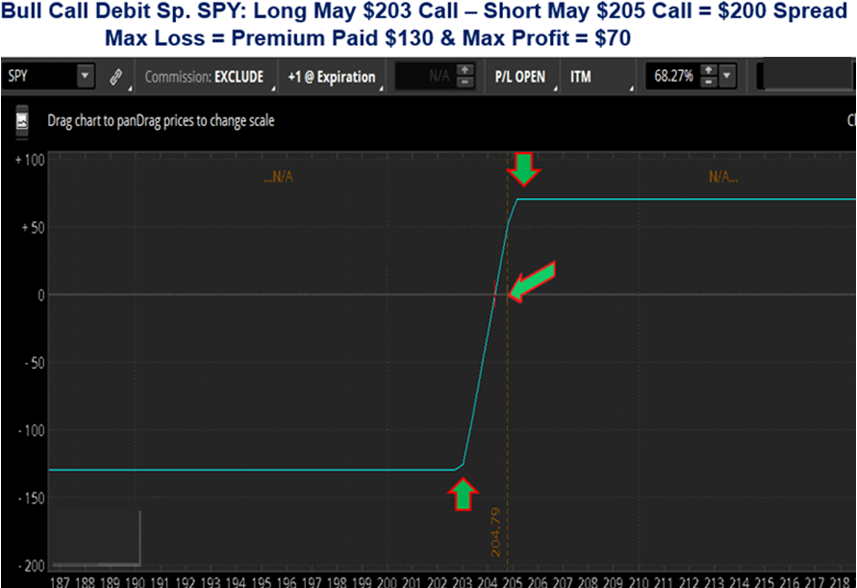
Vertical Bull Call Debit Spread

Vertical Bear Call Credit Spread

Selecting the Right Butterfly Option Strategy

One major goal of every trader should be to select trades based on what provides the most consistent positive return with low, defined risk. Not always the greatest return.

And one of the best ways to achieve this is by knowing the Option Butterfly Strategies that are available, how they work and then selecting the one that is best suited for the market environment you are trading.

Butterfly Strategies

  • Long Call or Put Butterfly
  • Short Call or Put Butterfly
  • Broken Wing Call or Put Butterfly
  • Unbalanced-Ratio Butterfly
  • Broken Wing Unbalanced-Ratio Butterfly
  • Directional Butterfly
  • Iron Butterfly
  • Hedging – Defenses Using Butterflies

The Butterfly Foundation = The Balanced Butterfly

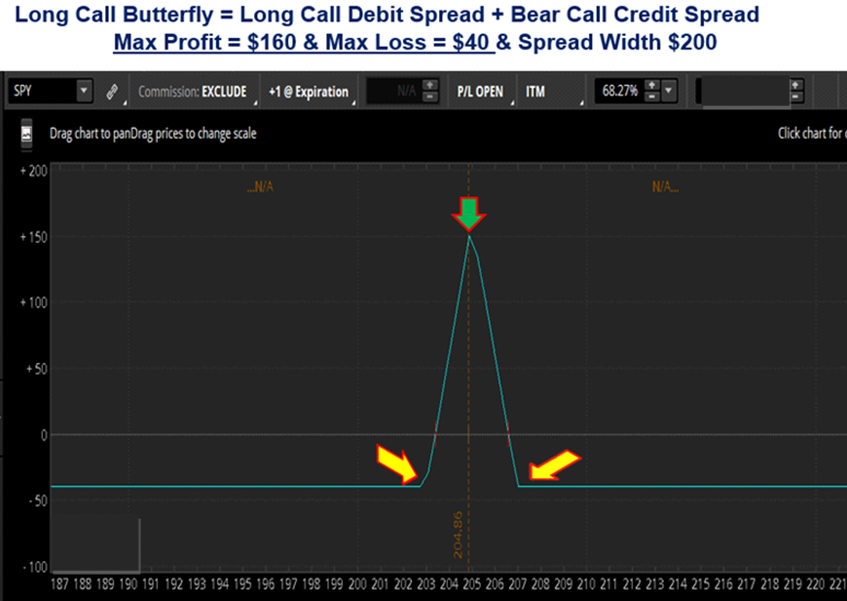
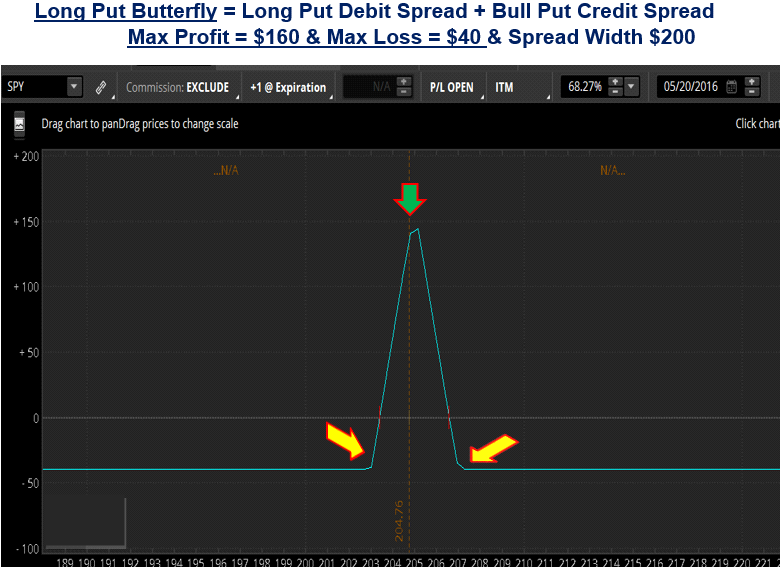
         Long Call or Put Butterfly Spread

  • It’s a combination of a bull call debit spread, and a bear call credit spread
  • It is a limited profit, limited risk options strategy
  • There are 3 striking prices involved in a butterfly spread and it can be constructed using calls or puts
  • Called a butterfly spread because you are short the body & long the wings
  • Can be used as a neutral or directional option trading strategy
  • Trade results in a small net debit & max risk is the debit paid
  • Due to small net debit, this strategy offers a great risk-to-reward
  • Short Volatility & Theta Strategy
  • A target price pinning strategy
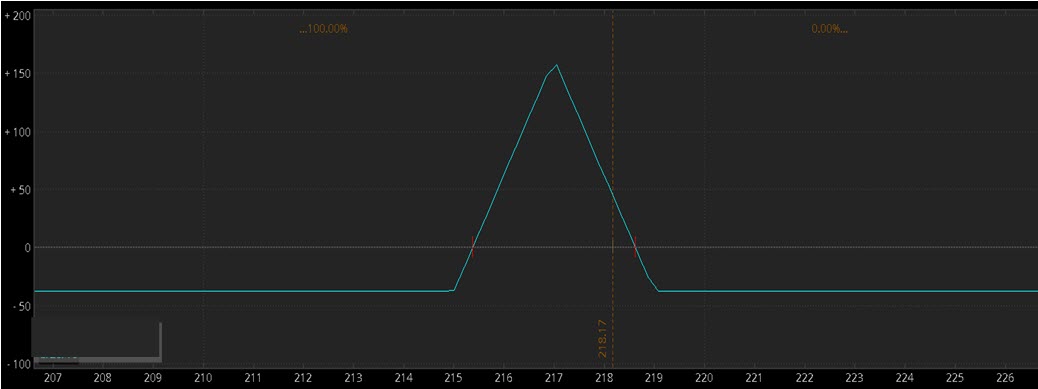
Max Profit

The maximum profit occurs should the underlying stock be at the middle strike or body at expiration.

In that case, the long call with the lower strike would be in-the-money and all the other options would expire worthless.

The profit would be the difference between the lower and middle strike (the wing and the body,) less the premium paid for initiating the position, if any. 

Max Loss

The Maximum loss occurs should the underlying stock be outside the wings at expiration.

If the stock were below the lower strike all the options would expire worthless

If above the upper strike all the options would be exercised and offset, each other for a zero profit. 

In either case the premium paid to initiate the position would be lost.

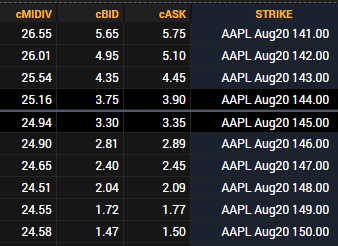
Balanced Butterfly Spread Example:

Assuming xyz trading at $45 ~ Directional Price Target $43

Buy to Open 1 contract of August $44 Call at $1.06

Sell to Open (2) contracts of August $43 Call at $1.67
Buy to Open 1 contract of August $42 Call at $2.38

Net Debit = ($2.38 + $1.06) - (2x $1.67) x 100 = $10.00 per spread

Profit Calculation of Butterfly Spread:

Maximum Profit = (Middle Strike - Lower Strike - Net Debit) x 100

Assuming xyz closed at $43 at expiration.

Maximum Profit = $43 - $42 - $0.10 = $0.90 x 100 = $90.00 per spread

ROC = $90/$10 = 900% or R: R 9-to-1

Let’s review what was covered in this Presentation on The Option Butterfly:

I. Best Market Conditions for Butterflies

II. Benefits of Butterflies

III. The Option Greeks You Need to Know First

IV. The Most Important Option Factor

V. The Butterfly Setup

THE SPECIAL OFFER

If you would like to learn more about this chart pattern and my other favorites, along with the directional trading tools we use, at Power Cycle Trading then use the link below and you'll receive one month access to our Power Cycle Trading Club free of charge.

Power Cycle Trading Club

Here is what you will receive:

  1. Virtual Trading room – Open from 9:25 AM until 4:15 PM EDT
  2. Daily Market Update Videos for Day Traders and Swing Traders
  3. Live Weekly Q&A with Larry
  4. Trader’s Education Vault
  5. Monthly Award Points - $20 credit for each month of membership. (Credits can be applied to all current or future courses)
  6. 50% Discounts on All Courses & Trading Software

ABOUT THE AUTHOR


Author: Larry Gaines, Founder
Company: Power Cycle Trading
Website: PowerCycleTrading.com
Services Offered: Trading Courses, Bootcamps/Coaching, Custom Indicators
Markets Covered: Stocks, Options, Futures

Chapter
08

Using Put-Call Ratios to Help You Find Better Options Trades

By Lawrence G. McMillan, McMillanAsset.com

Put-call ratios are useful, sentiment-based, indicators.  This indicator was discovered by the late Martin Zweig back in the 1950's, when he noticed the option volume in put-and-call broker ads in Barron’s.  There were only 6 or 8 such brokers, and each would advertise every week.  In the ad, they’d report the number of puts and calls traded during the prior week.  Zweig noticed that when the ratio of puts to calls was extremely high (that is, “everyone” was bearish), the market tended to rally.  Conversely, when the number of calls to puts was extremely low, “everyone” was bullish, and the market tended to decline.  We have much more sophisticated ways of getting at that information today, but the concept is still the same – it’s a contrary indicator.  It can be used on individual stocks, futures contracts, ETFs, and indices (as long as they have listed options trading), and one can also group those options to get broad market indicators.

The Standard Put-Call Ratio

The standard put-call ratio is simply the volume of all puts that traded on a given day divided by the volume of calls that traded on that day.  The ratio can be calculated for an individual stock, index, or futures underlying contract, or can be aggregated.  For example, we often refer to the equity-only put-call ratio, which is the sum of all equity put options divided by all equity call options on any given day.  Once the ratios are calculated, a moving average is generally used to smooth them out.  We prefer the 21-day moving average for that purpose, although it is certainly acceptable to use moving averages of other lengths.

The chart on the right below is a sample put-call ratio chart – of IBM.  Buy and sell points are marked on the chart.  Note that buy signals occur when the ratio is “too high” (i.e., near the top of the chart) and sell signals occur when the ratio is “too low” (near the bottom of the chart). Specifically, buy signals (for the underlying) occur at local maxima on the put-call ratio chart, and sell signals occur at local minima. The chart on the left below is that of IBM common stock, with the put-call ratio buy and sell signals marked on it.  You can see that, in general, the signals are good ones.  In reality, we couple technical analysis – using support and resistance levels – with the signals generated by the put-call ratios.  The combining of the two methods normally produces better-timed entry and exit points in our trades.

The Weighted Put-Call Ratio

A dollar-weighted put-call ratio is constructed by using not only the volume of the various options, but their price as well.  The two are multiplied together (we use the day’s option volume times the closing price), and the total of that product for all put options is divided by the total of that product for all call options.  That computation is the daily weighted put-call ratio.  As with the standard put-call ratio, this weighted ratio can be computed for individual stocks, futures, or indices, or for aggregated groups of options.  What this weighted ratio attempts to show, which the standard ratio does not, is how much money is being spent on puts versus how much is being spent on calls.

The thinking is that it is more important to know how the total money is being spent than merely knowing the volume.  This point has some validity.  For example, a person who is merely hedging his position perhaps is not really all that bearish, but just wants to buy some puts as insurance.  He might buy fairly deep out-of-the-money puts.  Thus, not many dollars would be spent on such low-priced puts.  On the other hand, a truly bearish speculator would most likely buy a put with a higher delta – something that is at-the-money, or perhaps slightly in-the-money.  Thus, this “true” bearishness would perhaps result in a higher expenditure in terms of dollars spent on puts.

The main difference between the standard and weighted ratios is that the weighted put-call ratio generates more extreme readings – especially at major turning points.  That is, during bullish periods the weighted reading can dip down to 0.20 or below on a given day, even pushing the 21-day moving average down to those minimal levels at times.  The standard put-call ratio rarely gets that low, especially where equity options are concerned.  Furthermore, during extreme bearishness, the weighted ratio will easily rise above 2.00 on individual days, and the 21-day average can rise to nearly 2.00 as well.  Again, those kinds of numbers are generally unheard of for the standard ratio.

As an example, let’s look at the big picture, via the equity-only charts.  The two charts below show the standard ratio (on the left) and the weighted ratio (on the right).  The buy and sell signals are marked on the charts.  For these charts, the major buy and sell signals occur at relatively the same points in time.  On each chart, the top line is an unscaled graph of $SPX (the S&P 500 Index).

The Y-axis scale on the weighted chart shows the relatively dollars being spent.  For example, 90 means $90 are being spent on puts for every $100 being spent on calls.  On the standard chart, the Y-axis scale is merely the ratio of puts to calls: 100 means that 100 puts traded for every 100 calls (i.e., the put/call ratio was 1.00).

On the weighted chart, one can easily see that the put-call ratios were at their highest at the depths of the decline in December 2018.  That was a peak of fear and put buying.  Moreover, at the lows on the charts, there was vast optimism and complacency (more calls trading than puts); those were sell signals – for example, in late September of 2017.

In summary, put-call ratio charts are very useful – especially the weighted charts. When using these to make a trade, it is probably best to buy at-the-money options and be prepared to risk the entire premium if you are wrong. Combine technical analysis with the signals generated by these sentiment indicators, and you should have a good system for speculative trading.

Our company publishes over 600 individual put-call ratio charts – both of the standard and weighted variety – every day on our website at www.optionstrategist.com.  These are located in the “data” area of our website, which we call The Strategy Zone.  Moreover, our Option Strategist and Daily Strategist newsletters make recommendations based on certain of these put-call ratio charts, and our track record on these has been strong over the past few years (that track record is available on the website).

THE SPECIAL OFFER

Get a free 30-day trial to my flagship advisory service, The Option Strategist Newsletter.

Scroll to the bottom, click the “ADD TO CART” button ($28.75) and enter the Coupon Code TPFREE at checkout. No credit card is required. Subscription will not automatically renew upon completion.

ABOUT THE AUTHOR


Author: Lawrence McMillan, Founder
Company: McMillan Asset Management
Website: McMillanAsset.com
Services Offered: Trading Education, Account Management Services
Markets Covered: Stocks, Options

Finally...
You Can Get
The Edge!

Bryan Bottarelli teaches his readers the techniques needed to possibly achieve remarkable gains - while strictly limiting their total risk.

Bryan is taking everything he learned on the Chicago Board Options Exchange and he’s finding the BEST trade idea for you every single week…

Because now it’s your turn to FINALLY get the edge.

And it all starts with these 5 trades...

Get 5 Trades For Only $5

After you grab your 5 trades…

Bryan will send you his latest trade ideas and research…

Including his highest-conviction trade idea of the week and ALL of his research…

Plus you’ll get access to his trading lesson videos… and his online training manuals.

All part of your brand new FOUR WEEK Newsletter Subscription.

It’s a no-brainer for only $5 Bucks

Chapter
09

TRADING TRICKS THE PROS USE AND YOU CAN TOO!

By Dr. Barry Burns, TopDogTrading.com

INTRODUCTION

What? You mean there are trading “tricks?”

Well, yes and no. None of these “tricks” are magical ways to make money in the markets. But they do represent things the pros do, and most amateurs don’t do.

In this way, it’s something the pros have “up their sleeve.”

Now some of these things you may already “know.” At least you think you know. And maybe you do know … intellectually. But that doesn’t do any good.

Knowledge is NOT power!

Applied knowledge is power. Action is power.

So, the ultimate “trick” to trading is to work on your own self-discipline and master yourself. Successful trading, like all great achievements, is about self-mastery.

That’s the truth, but you probably bought this Special Report because you were looking for some new trading “techniques.”

So that’s what we’ll focus on.

These are some techniques that pros use, and amateurs don’t … or don’t do correctly. Again, remember it’s the DOING not the KNOWING that’s critical. The pros are different and they’re making money because they apply some or all of these techniques in their trading consistently.

BUY INTO SELLING AND SELL INTO BUYING

It’s well known that the crowd is normally wrong. Contrary thinking is often the key to success in trading. Doing this requires nerves of steel, however. It’s unnatural for human beings. Since we’re social beings our “herd” instinct is very strong.

But the nature of the markets, being a mass-market auction place, is such that trading with the crowd doesn’t work in your favor. Being a rogue is the secret to success. And that means DOING WHAT IS UNCOMFORTABLE.

The chart above is an example of where a pro might find an excellent buying opportunity. What about you? Would you BUY that last bar? The market is going down and not showing any signs of reversing. There’s also a gap below that may get filled. Besides, you’re not supposed to buy a “falling knife” right? Traders who misinterpret this pattern to be a falling knife, know just enough about technical analysis to get their accounts sliced to pieces!

On the longer-term chart you can see that what looked like a move DOWN, was actually just a small retrace in a new uptrend on the longer time frame. As the market comes down, it is retracing into a cluster of support.

Rather than waiting for the market to bounce and then take a long position, the professional trader may just buy into the selling. Looking back at the short-term chart, it would be very uncomfortable for most people to BUY while the market is moving DOWN short-term.

That’s why it works! Amateurs like to wait for a lot of confirmation before they enter a position. But waiting for a lot of confirmation before you buy, means buying at a higher price. The pro wants to “buy low and sell high.” The best way to buy low is to buy before price moves up!

The obvious objection is, “How do you know it’s going to bounce?”

We don’t know that the market will continue its long-term trend up, but the short-term odds are that when the market is in an uptrend and it retraces into a cluster of support, it will produce at least a small bounce up.

Making this work in real life requires nerves of steel and impeccable money management. It’s the money management that allows you to move into these positions and trade them profitably.

Just remember: By the time you would be buying a retrace, there are other people lightening their long positions … meaning they got in way before you and are now selling some of their position to adjust their overall cost in the trade!

The “trick” is to buy below support and short above resistance. This works for several reasons:

  1. When the market holds support, it normally will “pierce” support, allowing you to actually buy BELOW the support level, even though it “holds” most of the price action (and the bars on the chart).
  2. Even when support doesn’t hold, and the market breaks down through support, the first attempt normally results in at least a little reaction or bounce up off support. Thus, allowing you to get in near the bottom of the swing, making your risk smaller than it otherwise might be.

The above chart shows how price found support and resistance at the 50 MA of the S&P Daily Chart. Even though support and resistance held each time, notice that price went BELOW support and ABOVE resistance, giving you a chance to enter at those extreme levels.

This can provide you a tremendous edge against other traders! You want to be FIRST in?

Again, you have to employ some advanced money management techniques to make this work in real trading, including “legging in” to a position.

I teach the complete rules for this in my Advanced Trading Course.

CONCLUSION
 

In a brief Special Report like this I don’t have the space to go into all the details of how I personally trade these principles. However, you have enough here to apply to whatever trading methodology you may currently be using. Adding just ONE of these tricks to your trading can increase your trading profits tremendously.

Your next step is getting my Market-Timing Indicator to give you accurate and precise entries for your trades.

You can get it for free (with a complete tutorial) by clicking on the button below.

ABOUT THE AUTHOR


Author: Dr. Barry Burns
Company: Top Dog Trading
Website: TopDogTrading.com
Services Offered: Trading Education, Free Videos, Books
Markets Covered: Stocks, Options, Futures

Chapter
10

My Favorite Rally and Pullback Strategy

By Rick Saddler, HitAndRunCandlesticks.com

Have you ever heard "There's no such thing as a free lunch."? That may be true, but I’m here to prove there are some exceptions.

In this short video, I am going to share my favorite chart setup, indicators and Rally-Pullback Strategy that can be used to trade the markets in any timeframe. 

I am also going to share how you can get free 30-day access to my Trader Vision 20/20 services.  Check out the SPECIAL OFFER below to learn more about this incredible program

THE SPECIAL OFFER

Get 30-Day Free Access to Trader Vision 20/20 Program by clicking on the button below.

This incredible offer will provide you with a 30-day FREE Trial of my Trader Vision 20/20 Program which includes full access to my Hit and Run Candlesticks, Right Way Options trading services and Live Trading Alerts software. No strings attached. No obligation. No credit card required. Just 30 free days of trading education, access to our trading rooms, phone app, as well as, free access to the Live Trading Alert software I use every day. 

Here are just a few things you’ll learn during your 30-Day FREE Trial:

· How to set up and use the Trendicator

· How to set up and use the T-Line

· How to set up and use the 3/8 Trap

· How to set up and use the "Below Highest High 5 Days PBO"

· All scans will be given to you so you can use them at any time during your trial.

ABOUT THE AUTHOR


Author: Rick Saddler, Founder & CEO
Company: Hit and Run Candlesticks
Websites: HitAndRunCandlesticks.comRightWayOptions.com
Services Offered: Live Trading Room, Trading Education, Software
Markets Covered: Options, Futures, Stocks, 

Here’s An Easier, Far More Effective Way

to Grow Wealth...

Did you know that there are certain patterns that happen with specific stocks… and they repeat themselves literally the same time every single year...

Like clockwork…

It’s not only consistent… but predictable too!

Would you like to see my 10 patterns?

How about if I give them to you…

Along with the names of the stocks…

The dates they are scheduled to go up and by how much…

And for how long…

Click to watch the video below and I’ll give you my 10 patterns - absolutely FREE!!

Chapter
11

How to Build a Home-Based, High-Probability Trading System

By Peter Schultz, WealthBuilderPublishing.com

Most trading strategies concentrate on some aspect of technical analysis--and that's great because charts are important--but there are two aspects of trading that are far more important.

The first is probability and how critically important it is to have it on your side. This really is your edge--not how smart you are or how good looking or any other personal characteristic--because if you set your trades up with enough mathematical probability on your side you'll win the vast majority of the time--automatically.

And the second thing traders typically don't talk about--for good reason--is how easy a strategy is to implement. That's because most of them love to trade--they love to hover over their computers all day trying to time the perfect entry or exit. But wouldn't it be more fun to be out doing all the things you love?

The strategy you are about to see truly is a 'lifestyle' strategy because it takes maybe 30 seconds to place your trade--and another 30 seconds to set your stop--and you are done. You literally never have to worry about when to exit a trade--either to stop a loss or collect a profit--because with this automatic money-machine it will all be taken care of for you with our favorite broker's multi-million dollar software that you literally get for free by simply opening an account.

If you've been looking for a way to replace your job-derived income with trading income this truly is the answer. And you'll get to see all the juicy details in this action-packed super revealing 33-minute webinar.

THE SPECIAL OFFER

Get the Complete Winning Secret Training Program by pressing the button below.

ABOUT THE AUTHOR


Author: Peter Schultz, Founder
Company: Wealthbuilder Publishing
Website: WealthBuilderPublishing.com
Services Offered: Trading Courses, Coaching, Weekly Advisory Newsletter
Markets Covered: Stocks, Options

Chapter
12

The 4 Questions You Must Ask Yourself Before Each Trade

By Steve Primo, ProTraderStrategies.com

Most traders are just a few steps away from achieving total consistency, but these trading rules can be the difference between success and failure in the markets. When I first started trading on the floor of the Pacific Stock Exchange I was introduced to guidelines that have helped sustain my trading for over four decades. But in order to apply these concepts correctly, important questions must first be asked.

Join Steven Primo, Former Stock Exchange Specialist and 44-year professional trader as he reveals the “The 4 Questions You Must Ask Yourself Before Each Trade.” In this educational presentation Steven will reveal 4 extremely simple trading edges that are designed to increase your odds for consistency regardless of what market or time frame you trade. These components are at the core of Mr. Primo’s many consistent trading strategies and by the end of this presentation all attendees will know exactly how to apply them to their own personal trading.

  • How to instantly be in sync with the overall market
  • Identifying trade loss levels
  • Identifying trade profit levels
  • Protecting your trades

THE SPECIAL OFFER

Get Steve's "Primo Strategy #4 Special" by clicking the button below.

Learn how to identify the high momentum stocks with 1-3 day price surges.

ABOUT THE AUTHOR


Author: Steven Primo, Founder
Company: Pro Trader Strategies, Specialist Trading
Websites:  ProTraderStrategies.comSpecialistTrading.com
Services Offered: Trading Courses, Trade Signals, Member’s Section, Videos
Markets Covered: Stocks, Emini Trading, Forex, Day Trading, Swing Trading

Get 4 Weeks of
Bryan’s Brain…

Bryan has an 86% Win Rate… and your next trade could be a big winner!

When you grab your 5 trades for $5 >>> Click Here

Bryan will give you a 4 week newsletter subscription.

It’s a no-brainer for only $5 Bucks

But that’s not all…

When you grab your 5 trades, Bryan is going to throw in some amazing bonuses including…

  • 5 High-Conviction Trade Ideas - Plus all of his research – Over the next month
  • The “Options for Dummies 101” Tutorial (Value: $99)
  • Bonus Training Video: How to Make Up to 3,700% With the Legged Spread (Value: $199)
  • The Eight-Part Video Training Series Wall Street’s Most Treasured Secrets UNCOVERED! (Value: $899)

Don’t miss out on this opportunity…

Bryan has a proven track record… with a long list of winning trades.

Get yours right here...

Get 5 Trades For Only $5

Chapter
13

Options Income Strategy: Writing Puts

By Jeff Tomkins, AltosTrading.com

When you sell or “write” Put option contracts it allows you to profit from 3 outcomes, not just one.

When you write a Put option contract, you profit if the stock rises, stays stagnant, or even moves down slightly.

We will be selling Put options (STO), not buying them, because it gives us a much higher probability trade.

However, if you buy a Call option the stock has to move quickly and significantly to overcome time decay in order to profit. If it does not, you risk losing your entire investment.

Both are bullish positions, but Put selling has a much higher probability for success. High probability allows for consistency. And consistency is truly the “holy grail” of trading.

A naked Put write, or short Put, is when you Sell-to-Open Put options without first being short in the underlying stock.

When the stock rises, the put options that you sold expire out of the money, allowing you to keep the entire premium you collected when you sold them.

Example:

ABC stock is trading at $100 per share. You decide to sell-to-open (STO) 10 of the 95-strike contracts for $2.5/contract that expire in 30 days.

Since each contract controls 100 shares of stock, you receive an immediate deposit of $2,500 into your brokerage account. As long as ABC stock closes above $95 (the strike price) at expiration, you keep the entire $2,500 premium you received when you initiated the trade.

One would sell Puts on a stock when they expect a rise in the price of the shares, but still want the ability to make a profit if the underlying stock stays stagnant or even declines.

When you Sell-to-Open a put, you are essentially playing the role of the “casino” where you are selling put options to “gamblers” who are betting on the price of the underlying stock going down. If they are wrong and the stock rises, you keep the money they paid you for the put options if the put options expires Out-Of-The-Money (OTM). If the gambler, or option buyer, is correct and the stock falls, you could potentially suffer a loss. That is how Put selling works in a nutshell.

There is a huge added benefit to selling Puts, and that is the ability to profit even if the underlying stock stays stagnant or moves against you. This is due to what is known as Time Decay.

Time Decay

The ratio of the change in an option's price to the decrease in time to expiration. Since options are wasting assets, their value declines over time. As an option approaches its expiration date without being in the money, its time value declines because the probability of that option being profitable is reduced.

The more the value of the options you sold decay, the more you profit from the sale. By writing a put option, you are not only making money if the underlying stock rises due to delta effect, you are also putting Time Decay, which is the biggest threat to buyers of stock options, in your favor.

Writing a put option is never really "Naked" or "Uncovered" because you need to have an amount of cash, known as a Margin, on deposit with your broker before you can initiate a trade. In fact, because you are obligated to buy the underlying stock at the strike price of the put options sold, some option trading brokers require option traders to have that corresponding amount of money before they are allowed to sell a put option. This is known as a Cash Secured Put.

Delta

Delta is the amount an option price is expected to move based on a $1 change in the underlying stock.

Calls have positive delta, between 0 and 1. That means if the stock price goes up and no other pricing variables change, the price for the call will go up. For example, if a call has a delta of .50 and the stock goes up $1, in theory, the price of the call will go up about $.50. If the stock goes down $1, in theory, the price of the call will go down about $.50.

 Puts have a negative delta, between 0 and -1. That means if the stock goes up and no other pricing variables change, the price of the option will go down. 

For example, if a put has a delta of -.50 and the stock goes up $1, in theory, the price of the put will go down $.50. If the stock goes down $1, in theory, the price of the put will go up $.50.

How to Choose the Best Put - Options to Sell

  • Use Delta or ‘Probability Out-of-the-Money’ statistics
  • Choose options with expiration dates 30-60 days out
  • Support/Resistance levels – Sell Put options with Strike prices below key support levels
  • Trade with the trend – Sell Put options on quality stocks in a strong uptrend or bouncing off a key support level
  • Implied Volatility (IV) – Focus on selling Put options when IV is relatively high

Advantages of Selling Put Options

  • A strategy which results in a credit, or deposit, into your account upon initiating the trade
  • Unlike other more complex option strategies, it is a simple strategy which requires no difficult calculations to execute.
  • Commissions tend to be lower due to the nature of the trade.
  • If the trade expires out-of-the-money (OTM) you pay nothing to close the trade.
  • It allows you to profit even if the underlying stock stays completely stagnant.
  • Unlike a long Call option, writing Put options offers you a margin of error if the underlying stock falls instead of rises.
  • It is a versatile option strategy which can be transformed into other option strategies prior to expiration, in order to accommodate changing market conditions or outlook.

What to do When Things Go Wrong

Imagine you’ve sold 10 Put option contracts on ABC stock, but then the stock immediately begins to go down in price. However, rather than closing the position and taking a loss, you are able to repair the position and prevent further damage, and even turn the trade into a profitable one.

Well there is a way to do this and it’s called Delta Neutral hedging.

This is a technique which will create a position that will not only help halt further directional losses, but also allow the overall position to start making a profit. This is the first trade adjustment we make when a trade moves against us.

 Trade Adjustment: Delta Neutral Hedging (DNH)

Delta neutral hedging is a very useful and powerful method to repair losing positions.

In order to transform a naked put write into a delta neutral position, all you have to do is to buy (buy-to-open) enough at the money or near the money put options in order to completely (or as completely as possible) offset the positive delta of your existing ort put options.

By executing this adjustment, if the stock should continue to fall, you will profit on the Put options that you purchased. This will offset losses on the ones that you sold if the stock continues to move lower. I will typically do this if my short Puts move in-the money.

  1. Calculation: # of Contracts X (Delta X 100) = Position Delta
  2. Then divide at-the-money (ATM) option delta by the Position Delta to get the number of contracts to buy

Trade Adjustment: Rolling

Let’s say we make a Delta Neutral trade adjustment to a losing trade, and it still does not become profitable by the time the options are set to expire. In this case, we will execute our next trade adjustment method:

Rolling.

Rolling involves closing out our initial trade (the short Puts) and opening a new trade at a further out expiration. Ideally we want to do this for an equal or greater “credit” or deposit into our account.

Depending on where the stock price is, and any profit we made from Delta Neutral Hedging, we may also want to continue to hedge our trade using our first trade adjustment.

Rolling buys us more time, and allows us to recover losses from our initial position should the stock price increase. It is a very powerful technique, but should only be used with high quality stocks.

Generally we will roll a position right before expiration if we have not yet achieved a profit.

THE SPECIAL OFFER

Trade Alert Bundle Package

Trade Alert Service includes our Put Writer, Credit Spread & Stock Trade Alerts.  Easy To Follow Trade Alerts Delivered via Email & Text Notification, Includes Trade Adjustments To Fix Losing Trades.

Includes Professional Trading Series Training Course

ABOUT THE AUTHOR


Author: Jeff Tomkins, Founder
Company: Altos Trading
Website: AltosTrading.com
Services Offered: Trading Software, Coaching, Trading Courses, Trade Alerts
Markets Covered: Stocks, ETFs, Options, Futures, Currencies

Chapter
14

Hedge Fund Secrets Revealed

By Mark Sebastian, OptionPit.com

The Hedge Fund Secrets Checklist

Hedge funds are incredibly good at one thing: making money.

Why?

Because they do not trade like retail traders.

Hedge funds think and trade several steps ahead of even the best retail traders out there.

The moves they make are strategic, precise, and developed with a specific action plan for each and every trade.

If your goal is to trade like the “Big Boys,” there are some things you have to do to create the type of environment in which you can succeed.

In this article, you will receive a complete checklist of these action items, complete with explanations on how you can think and act like your very own hedge fund manager.

(Of course, if you don’t want to go through this checklist every time you make a trade, our Capitol Gains program can do it for you!)

Hedge Fund Set Up
 

Developing a Trade:
 

When hedge funds trade, it’s not on a whim.

The process is measured, considered and usually traders need to pitch a trade idea to the CIO, rather than trading whatever they want to.

Furthermore, these trade ideas can’t be “simple” trades.

Retail traders, meanwhile, generally stop at the easiest answer.

Here’s an example:

Imagine an infrastructure spending bill gets passed, meaning roads will be built …

Retail traders might think to buy Caterpillar (Ticker: CAT) or Deere & Co. (Ticker: DE) because they make heavy machinery and may benefit from the bill.

Or maybe they anticipate a need for steel, so they buy U.S. Steel Group (Ticker: X).

These are not bad ideas, but generally speaking, everyone knows this.

When a trade is made based on common knowledge, it tends not to produce results.

The hedge funds, however,  take a different approach -- and think a little deeper, for instance ...

“All the equipment will need maintenance and parts. Who is going to service the vehicles?”

“There will be a lot of concrete poured, and someone needs to make all that concrete, and concrete needs minerals to be made. Who provides those minerals?”

“U.S. Steel Group will need raw ore; who is going to dig all that up?”

Or one step further … “Who makes the equipment miners use to dig up materials? Who has those mineral rights?”

It is within these deeper questions that real money can be found.

Sometimes the answers to these deeper questions are not always obvious or easily found.

This is why hedge funds collaborate with experts in specific areas; they are the ones who can find these answers.

When developing a story for a trade idea, take the story as far as you can take it, and then find the trade. That is what hedge funds do.

✓ Check list item #1: Where does the story behind the headline really end? Take the pitch all the way down, and then find the trade.

Executing a Trade:

Hedge funds do not use ThinkorSwim or Tastyworks to trade. Those are fine platforms, but they are not what hedge funds use.

Hedge funds have something called Direct Market Access (DMA). What’s the difference?

Speed.

DMA goes directly to the exchange to take out an order; it does not have to route to first go through a broker. So if a hedge fund wants to put an order through, they just click ‘buy’ or ‘sell’ and the order is taken.

Here’s the good news: it doesn’t really matter that much.

But there are some things you can do to put yourself on more equal footing.

For starters, I advise against using a free broker.

ThinkorSwim -- for all its faults -- does have one nice feature: order routing to an exchange. This will get better fills on both marketable orders (if you route to the exchange that is bid), and more importantly, non-marketable orders (orders that you are “working”).

How do you do it on ThinkorSwim? It’s actually pretty simple. When you pull up the order bar, at the very end, there is a category called “exchange.”

This defaults to ‘best,’ which means it gets sent to the market maker who is paying for the order flow. However, if you change the order to ‘CBOE’ or ‘ISE,’ you are far more likely to get a fill on a working order.

These types of little things in order routing are key to getting better fills on your trades -- closer to what a hedge fund might get.

If you do not use ThinkorSwim, many other brokers also have ways of routing the order. It is important to take the time to learn how to do so in order to optimize your execution.

✓ Check list item #2: Learn the best way to execute an order with the broker you use.

Picking the Option:

Retail traders tend to either buy simple calls or puts, or use simple strategies like covered calls.

Hedge funds will employ these kinds of trades as well, but they will also look at hedging strategies such as straddles and strangles.

How do they develop their options strategy?

The answer is implied volatility (IV).

Hedge funds that trade options always have professional options traders on staff.

These options traders are especially knowledgeable about one thing in particular … volatility.

Why volatility? It helps them find the best way to express their trade idea.

Simple calls or puts are fine, but as a retail trader you need to ask yourself, “Is this the best way to trade this? Is this the best option to buy?”

If you cannot quickly answer this question, you need to do a deep dive on implied volatility.

By understanding IV, you will come to understand options at a deeper level, much closer to the level of the options traders hedge funds employ.

(Option Pit can help with that, too.)

Let’s look at an example ....

You want to go long on Apple (Ticker: AAPL). What do you do?

Here’s how you can develop a trade quickly.

Look for the cheapest month to buy, then within that month find the cheapest option to buy that has reasonable odds of ending up a winner.

Here’s the catch: when I say “cheap” I’m not talking about the price of the option, I’m talking about the implied volatility.

The more IV that is priced into an option, the more expensive that option becomes. Finding reasonable trades with lower implied volatility will help you avoid overpaying for the options trades you are trying to make.

Every brokerage platform will show you implied volatility for recent contract terms.

Here’s some recent implied volatility readings for AAPL:

Is there one term that is cheaper than the rest?

As you can see, the Aug. 20 expiration is cheaper in terms of implied volatility than every other expiration around it.

Now take it one step further, and find the cheapest option to buy in that month.

AAPL is trading $145. Do you see an option that is cheaper than the others in terms of IV (cMIDIV)?

The August 148-strike calls are the cheapest option to buy on the board. This is the best play for a bullish options approach (please note this is for example purposes only, and is not a trade recommendation).

If you cannot do this, you need to learn how.

Selling options is exactly the same as buying, except I want to find the most expensive option.

Complex options plays like call spreads and strangles are often even better to trade than outright simple options. You should take time to learn how and when to trade these as well.

✓ Check list item #3: Learn to use implied volatility and complex spreads to optimize your options trading.

The Plan:

The final piece of the puzzle is the plan.

When hedge funds execute a trade, they have a complete trade plan. Many retail traders do not.

Retail traders tend to fly by the seat of their pants. They get into a trade on a whim, and exit on a whim. They panic at the worst times, and even worse, get greedy at the worst times.

Why?

They have no plan.

Hedge funds always have a plan.

Before taking a trade, they ask themselves these questions (and you should too):

  • What is my target entry price?
  • Where is my first exit point on a winner?
  • Where is my next exit?
  • If my option wins, do I roll up (exit your current position and enter a new position) to keep the trade going?
  • What factors will cause me to roll an option up?
  • If I do roll, what options would I roll to?
  • If the trade goes south, where is my exit?
  • What is my desired and maximum time frame for this trade?
  • If my trade reaches my maximum time frame and I am not out, what do I do?

Of course, having a plan is not enough -- you must follow it.

Any trader that does not follow their plan (or worse, doesn’t have a plan!) will not be working at a hedge fund for very long.

✓ Check list item #4: Create a complete plan for every trade.

Whether hedge funds are systematic or discretionary in their operations, the items in this checklist are always followed.

If you want to run your portfolio like a hedge fund, you need to make sure you hit all of the items in this checklist every time, whether you’re trading a systematic or discretionary retail strategy.

To sum up the list:

✓Item 1:  Find the true end of the trade story.

✓Item 2:  Optimize trade execution.

✓Item 3:  Pick the optimal option trade.

✓Item 4:  Build a thorough trade plan and follow it.

THE SPECIAL OFFER

PIT Report

Get the story BEHIND the headlines and avoid EXPENSIVE investing mistakes.

Pit Report is all about helping you understand WHY markets do what they do … so you can become a better trader and make more money!

ABOUT THE AUTHOR


Author: Mark Sebastian Founder
Company: Option Pit
Website: OptionPit.com
Services Offered: Trading Education, Training, Trade Room, Newsletters
Markets Covered: Stocks, Options

You Could Make 25-50%
in Profits Overnight...

Here’s How It Works…

  • You receive a straightforward real time alert
  • You copy the trade into your brokerage account
  • Have dinner, spend time with the family & go to sleep
  • Wake up and close the trade (per our instructions)

That’s it!

Seriously… Placing a Trade
Can Really Be This Simple

The results speak for themselves.
Take a look at just some of our winning trades…

  • Russell 2000 (IWM) +37%
  • S&P 500(SPY) +34%
  • S&P 500(SPY) +31%
  • Russell 2000(IWM) +38%
  • S&P500 (SPY) +37%
  • First Solar (FSLR) +17%

And the best part is…

Each of these trades only took anywhere from only $46 - $153 in capital per position.

Click here to see how to get started.

Chapter
15

Using the Short Iron Butterfly for Defined Risk Options Trading

By Eric Wilkinson, ProTraderStrategies.com

The Short Iron Butterfly is a defined risk market neutral option strategy that profits when the price of the underlying asset moves within a somewhat tight trading range. I will discuss how a Trader, who may be looking to take advantage of an underlying that is just stuck or not moving, can take advantage of this High Powered Setup. While watching this webinar, you will understand when to use the Iron Butterfly, where is the best strike location and why it is the right strategy for a market neutral assumption.

Join Eric "The Wolfman" Wilkinson, former Chicago Board of Trader floor trader and 25 year professional trader, as he explains his guidelines to trading the Short Iron Butterfly.   Eric will show the best strikes, optimal expiration, and what volatility needs to be before trading the Short Iron Butterfly.

THE SPECIAL OFFER

Learn How to Trade Options Like the Wolfman

ABOUT THE AUTHOR


Author:  Eric Wilkinson
Company:  Pro Trader Strategies
Website:  https://www.protraderstrategies.com
Services Offered:  Trading Schools and Trading Strategies
Markets Covered:  Futures, Stocks, Forex and Options