WestmarkTrading - Women in Wealth - Calm, Cool and Collecting Profits

Chapter 01

Wednesday | October 7th | 10:00 am ET

Liz Dierking & Jenny Andrews | tastytrade.com

The ZEBRA Options Strategy

  • For traders with limited capital or trading an IRA account
  • Has a 50% profit probability when set up correctly
  • Can be used for both bearish and bullish setups

Bullish or bearish??   Who knows where this market is headed? 

Come join 2 former floor traders Liz Dierking and Jenny Andrews as they show you how to place directional trades using a fraction of the capital and defining your risk.

In this video, they will talk about the ZEBRA strategy. ZEBRA is an acronym that stands for:

Zero
Extrinsic
Back
RAtio

This is a stock replacement strategy for traders with limited capital or for those who are trading in an IRA account. It can be used to hedge your portfolio or as a scalping method.

Join Liz and Jenny at the Women in Wealth workshop as they break down how to trade the ZEBRA options strategy.

SHORT VIDEO PRESENTATION: THE ZEBRA OPTIONS STRATEGY

ABOUT THE AUTHOR


Author: Liz Dierking and Jenny Andrews
Company: tastytrade
Website: tastytrade.com
Services Offered: Live, original programming for stock and options traders
Markets Covered: Stocks and Options


Chapter 02

Wednesday | October 7th | 11:00 am ET

Melissa Armo | The Stock Swoosh

Making a Living in Just 30 Minutes A Day

  • Why the market open is the best time to trade
  • My favorite index for gauging market direction
  • Finding high probability gap trades on selective stocks

For me, the market open is the best time to trade. I can usually read what the directional bias for the market will be for the rest of the day as soon as the market opens and within the first 30 minutes of the trading session. The key is looking for a gap between the close and open of the market, or a stock, and then acting very quickly and early in the morning.

In this short video, I will share my favorite market for getting an initial sense for what the overall market is doing, and how I look for high probability gap trades to trade on selective stocks.

Come see me at the Women In Wealth workshop on October 7-8 to learn more about how I trade the market open, and how you can make a living in just 30 minutes a day.

SHORT VIDEO PRESENTATION: MAKING A LIVING IN JUST 30 MINUTES A DAY

ABOUT THE AUTHOR


Author: Melissa Armo, Founder
Company: The Stock Swoosh
Website: TheStockSwoosh.com
Services Offered: Trading Rooms, Trading Courses, Newsletters
Markets Covered: Stocks, Options


Chapter 03

Wednesday | October 7th | 12:00 pm ET

Michele Schneider | Market Gauge

How to Grow Your Wealth in Your Free Time

  • Using consumer instinct to build wealth in the market
  • A simple technique for staying on right side of market
  • Steady process for finding and executing trading ideas

In the current stock market, with the upcoming Presidential election, a potential second wave of the pandemic, more government stimulus money on the table and a very dovish Federal Reserve, now more than ever is it time to learn how to prepare for the volatile coming months.

If you are like me, living in a world that moves so randomly that all of the conflicting information flying at us with blinding speed further confuses you; you seek simplicity and certainty.

Yes, the market is complex. Yet, I have spent over thirty-five years studying both big (macro) and small (micro) trends. One of the best and easiest ways to make investment decisions is by learning about market phases.

There are six phases. These six phases have successfully guided me and by extension, the thousands of folks I have taught and continue to teach during seminars, webinars, through e-books, my daily blog and social media.

Another way to think about phases is to see them as six pictures that tell six stories and invoke six different emotions. Each of these six stories/emotions influences every aspect of your life. How money flows directly and indirectly affects us all.

The six stories help you identify changes you need to make, when to make them and how. Once you identify the time to make a change, each story sets you up with specific guidelines to follow.

These guidelines give you the knowledge and the autonomy to make intelligent decisions that could make you and your family’s lives a lot better!

Your GPS For the Market

The best way to read the chart below is clockwise.

Six Phases Wheel

The above chart illustrates the flow of the 6 Phases in the market. Most people are familiar with the terms “Bullish” and “Bearish.” If you look at the chart like time on a clock beginning with the Bullish Phase as High Noon, you can see that moving clockwise, certain factors whether it be economic, geo-political, or even psychological might spook the market, moving it into the next phase, Caution. From there, if factors should become more negative, the phase will deteriorate into a Distribution Phase. If things deteriorate even further, there could be a decline into a Bearish Phase.

Recognizing Phases is Like Having a GPS

Knowing the Market Phases and what course of action to take in any given phase whether it’s to gauge the overall market, a sector of the economy or an individual stock, is like having your own GPS. With a GPS, you know where you are starting from and what direction you need to go in so you never feel or get lost.

The beauty of independently identifying and evaluating typical characteristics is to prepare for and to take action on each phase, which allows you to stay in step long before the news confirms the reason why a phase changes.

Most technical analysts (chartists) will tell you that the chart precedes the news. Imagine having the time to prepare for a downturn in advance rather than waiting for some “expert” to tell you that things are worsening. Or, in the opposite scenario, picture having a jumpstart on investing or making good financial decisions before the experts tell you to buy!

Perhaps the best feature of understanding phases is that like everything in life, there are cycles. Eventually, everything moves through each cycle. Often, a financial instrument might move in between two cycles, going back and forth for a long time before finding momentum in one phase or the other. In investments terms, momentum refers to the rate of change on price movements for a particular asset – that is, the speed at which the price is changing. The comforting part is that with the knowledge of phases you will gain; you will be able to pinpoint when the conditions and phases improve.

Using the “Grow Your Wealth in Your Free Time” approach to trading the markets, you’ll discover:

  • There are 6 Phases all easily identified

  • Knowing the Phase the market or any sector of the economy is in is like having a GPS. Attaching an emotion or sentiment to each phase humanizes its impact on the market and overall economy.

  • Headlines are misleading and often too late.

  • You will no longer feel solely dependent on the media, your financial planner or anyone for that matter, to make smart and timely decisions about your money under any circumstances.

The Consumer Instinct

Everyone has “Consumer Instinct” which can be used to build wealth in the stock market.

Some of my best financial decisions have come from going shopping and thinking to myself, “I better check out this stock, the store is insanely busy!” Or, “I better check out this stock, I notice this chain is expanding its operations.” Or even, “This store has gone downhill. I wonder if this stock is ready to sell off.” I have also talked to many people who never invested in the market before but made an investment decision after hearing about an innovator or a “hot” entrepreneur on the news.

Before COVID hit the market hard, my 87-year old mother told me she was going to play mahjong with her friends on Zoom. We were already using it for business but hearing that it was expanding rapidly into the mainstream got me real interested in the stock. We entered the stock long (we bought it) in May 2020 at $144.80. At the time, the stock fell back to a major moving average and held, thereby showing us that it would hold in a bullish phase. Since then, the stock has run to a peak price of $478. That is more than three times the price from our entry!

More frequently though, I talk to people who really have no idea that their instincts are worth following up on; and even if they want to follow up, have no idea what to look for.

What is the “Consumer Instinct?”

Peter Lynch is one of the most famous investors in the world. A former manager of the Magellan Fund at Fidelity, he averaged a whopping 29.2% annual return in his day. Lynch’s number one philosophy on investing is Only Buy What You Understand.

"If you stay half-alert, you can pick the spectacular performers right from your place of business or out of the neighborhood shopping mall, and long before Wall Street discovers them." Peter Lynch, One Up On Wall Street: How To Use What You Already Now To Make Money in the Market, Simon & Schuster, 2nd Edition 2012

According to Lynch, our research tools are our eyes, ears and common sense. Lynch would get some of his best stock ideas in a grocery store or chatting with friends and family. He believed that we ALL have the ability to see emerging trends when we watch TV, read the newspaper, or listen to the radio. His reasoning is that since we consumers represent two-thirds of the gross domestic product of the US, the stock market is actually in the business of serving us. If a product or service attracts us as a consumer, then it should also be of interest to us as an investor.

Lynch’s research after his “common sense” kicked in was largely fundamental in that he studied sales numbers, earnings growth, and debt-to-equity ratios. As a primary technical trader using the phases, I tend to stick more closely to the information that the phase, slope and price point indicates.

For the Women

My women friends are smart and amazing. They all work, have families, and function as the Chief Financial Officers of their homes. No small feat, they all look amazing too, and take great care of themselves!

The gamut of their jobs range from Manager of the front desk of Sotheby’s, Head of Human Resources at the local hospital, Medical Doctor, Author and Writing Coach, Real Estate Investor and Property Manager, Country and Western Singer/Songwriter, Chairman of the Board for Guiding Eyes and Director of Trading Education and Research at MarketGauge (oh wait, that’s me!).

Women and Investing

Although women have more patience and are more risk averse, studies show that women lack confidence when it comes to investing and financial literacy. Prudential’s research on the Financial Experience & Behaviors Among Women reveals that just 22% rated themselves as very well prepared for financial decision-making, compared to 37% of men. Yet, women live longer, therefore, they need to pay more attention to retirement saving and financial planning.

Most of my women friends have IRAs or 401Ks. Many of them tell me they rarely look at the statements and have very little understanding of the market. Furthermore, they go on to tell me that money scares them. What’s more, these are the smart ones!

Getting back to Peter Lynch and the consumer instinct, all my women friends love to shop! I hope to pass on to you what has been extremely successful to me.

Come see me at the Women In Wealth workshop on October 7-8 and learn more about my strategy for growing wealth in your free time.

ABOUT THE AUTHOR


Author: Michele Schneider, Director of Trading Education
Company: Market Gauge
Website: MarketGauge.com
Services Offered: Trading Education, Trading Tools
Markets Covered: Stocks, Options, Futures, Forex

Chapter 04

Wednesday | October 7th | 1:00 pm ET

Jody Samuels | FX Trader’s EDGE

How to Apply the 3 Top Elliott Wave Setups

  • How to read and understand the “Market Map”
  • Understanding which setups are the most profitable
  • System for consistently finding high probability trades

Welcome to this 3-STEP PLAYBOOK to help remove trading and investing uncertainty during this unique and volatile trading period.  If you are just starting your trading business or have been trading for several years, you will probably agree that having a roadmap to navigate the markets is the prudent course to take. My trading career began on Wall Street in the early 80’s and it is no surprise that I have traded through many different and challenging trading environments. The one constant is that no two trading days are the same. However, I do recommend learning a logical approach to better equip oneself to feel more comfortable trading and investing during any type of market cycle.

In my book, The Trader’s Pendulum, I describe how all traders trade the market, financial and emotional pendulums every trading day. Unsuccessful traders ride the pendulum back and forth with no real idea of the pendulum’s swing. Successful traders recognize that the pendulum swings and ride it mindfully – as a result, they make better decisions and better trades. The lack of skills to weather the swings is what makes trading an emotional – psychological roller coaster ride for traders.

The 3-Step Playbook that we are going to learn today will help us trade the market, financial and emotional pendulums mindfully. This Playbook provides the foundation and roadmap to navigate the markets during uncertain times and can be broken down as follows:

  1. Learn to anticipate market direction by reading the “Market Map” – to have a sense where the market is going before placing a trade.
  2. Master the 4 Lenses Checklist, which is the strategy that I use to identify and filter the markets to find one of our Wavy Tunnel PRO setups – to locate and trade high probability setups with confidence.
  3. The final step is to trade only the most highly lucrative setups for maximum profits by using well defined risk and trade management.

PRESENTING THE 3-STEP PLAYBOOK

1. ANALYSIS: THE MARKET MAP

The first step in achieving consistency is to have a thorough knowledge of the market to determine possible future scenarios and be prepared to take advantage of opportunities that arise. In our system we use the Market Map to provide market context and increase the likelihood of successful outcomes. The Market Map is the 8-wave market cycle, for uptrends and downtrends. There are ideal setups for every part of the cycle and how you trade Wave 3 for example, is not the same way you would trade a Wave 4 for anticipating the Wave 5 move. The key ingredient is to know the direction of the primary trend and when that trend is about to end. In the diagram below, the potential trades are highlighted with blue and red arrows for buying and selling.

To put it into perspective, the ideal market map on a candlestick chart below identifies the 3 trades to take during different parts of the cycle. These patterns can be found on any instrument, in any asset class, and on any time frame.

2. STRATEGY: THE 4 LENSES CHECKLIST FOR PULLING THE TRIGGER

The second step in my Playbook is to have a highly effective strategy which is easy to understand when making a trading decision. After a good analysis, strategy is used to identify the exact entry point, stop loss level, and profit target, to know when to trade and when to stay out of the market. Removing the emotions is key. The 4 Lenses Checklist is a simple strategy used to identify the end of the trend with confirmations. Very often traders “pull the trigger” too soon, only to see themselves whipsawed in the markets, which is why it is important to have numerous confirmations saying the same thing, in the form of a checklist. The following chart lists the checklist for the Point T End of Trend trade in an uptrend. This also applies to downtrends.

I follow extremely specific criteria in my 4 Lenses Strategy, to evaluate if I want to trade a specific setup as illustrated below. I remove subjectivity with the specific criteria. The greater the objectivity, the fewer the emotions!

THE 4 LENSES CHECKLIST EXAMPLE:

3. TRADE MANAGEMENT: OPTIMAL RISK/REWARD FOR ACHIEVING CONSISTENT PROFITS

The third step in my Playbook is Trade Management. The idea is to apply optimal Risk and Money Management overlaid with a Trade Management methodology to maximize profits. This step can tip the balance between being profitable or not. For example, by trading only setups with a minimum risk/reward ratio you set in advance (i.e. 1.5:1), you can refine your analysis and improve your performance stats immensely. Trade management is part of the equation because with a plan to identify profit targets, using multiple positions, you can take profits along the way and keep part of the position as the trade moves in your favor. Consequently, you need a smaller win/loss ratio when you have a plan to ride the position longer than you normally would!

CONCLUSION

The 3-Step Playbook that we just learned will help you trade any instrument, asset class or time frame mindfully. This Playbook provides the foundation and roadmap to navigate the markets during uncertain times and can be summarized into the following steps:

1. Read the Market Map (analysis);

2. Go through the 4 Lenses Checklist (strategy); and

3. Use well defined risk and trade management.

I hope you enjoyed this framework. Good luck in your trading business., and I look forward to seeing you at the Women in Wealth workshop!

ABOUT THE AUTHOR


Author: Jody Samuels, Founder
Company: The FX Trader’s Edge
Website: fxTradersEdge.com
Services Offered: Trading Courses, Live Trading Room, Daily Trade Videos
Markets Covered: Stocks, ETFs, Emini Futures, Forex, Day Trading


Chapter 05

Wednesday | October 7th | 2:00 pm ET

Celeste Lindman | Diversified Traders Institute

My Favorite Trade Setup

  • Clear signals that show which direction to trade
  • Identify weekly setups with strong profit potential
  • Strategy for trading any timeframe and market condition

Are you interested in a simple trade that sets up every week, long or short, and provides consistent explosive returns? This “let-the-market-do-the-work” style of trading is perfect for those who prefer golfing, boating and vacationing with family over staring at computer screens.

This is my favorite trade setup, and it's a Swing Trade, where I buy at wholesale and sell at retail in about 2-4 weeks or longer using stocks and options.

To trade this way, you need clear signals and a simple proven way to manage your trades. Learn more about this process in this short video ... then be sure to join me at the Women In Wealth live workshop,  where I'll dive into this in more detail and make it your favorite strategy as well.

SHORT VIDEO PRESENTATION: MY FAVORITE TRADE SETUP

ABOUT THE AUTHOR


Author: Celeste Lindman
Company: Diversified Trading Institute
Website: DTItrader.com
Services Offered: Trading Education, Software, Trade Alerts
Markets Covered: Stocks, Options, Futures, Forex


Chapter 06

Wednesday | October 7th | 3:00 pm ET

Stefanie Kammerman | The Stock Whisperer

Dark Pool Trading

  • What is the Dark Pool and why was it created
  • How to trade the Dark Pool and profit off manipulation
  • How to gain access to the Dark Pool

How many of you play a musical instrument? Many of you might not know this about me, but I am a published singer/songwriter with BMI. I have written over 100 songs and have placed many of them on some very popular TV shows as well as the radio. I always wondered what it was about the market that attracted me to it. I fell in love at first site. I literally went into a trance. I was attracted to the rhythm of it. When stocks moved up and down, for me it was like a musical scale up and down the charts. I felt myself tapping to the Wall Street beat. When the trend changed, the frequency changed, and it started to play a different melody.

The best trades I have made have been the ones that played perfectly on the scale, from key to key. Let me show you a picture of this. I teach my traders how to draw Channel Trendlines in my Boot Camp class.


You can see on this chart, the stock $DBO went up the scale from A, B, C, D, E, back down the scale to D, C, B, A, and back up to B, C.

In my class, I actually play the chart for my traders so they can hear it going up and down the scale.

As many of you may know, my biggest secret for picking the Whisper of the Day is premarket volume. That tells me which stocks are going to be hot that day. That is where the interest is going to be. I need to see at least 100K volume premarket in order for the stock to make my Whisper list.

For me, the premarket volume is the intro of the song for the day. I can see what octave they are going to start out playing for the day. I put my bullish above levels on my Whisper of the Day set ups for when they break above that octave, and I put my bearish below levels for when they break down through that octave. When the opening bell rings we are only on the first verse. You do not want to enter on the verse. It will fluctuate up and down, shaking you out. You really want to wait until after the verses to enter. The chorus starts around 9:45am-10:15am EST.  That is when the stock will soar or come crashing down. I’ve found that those are my best day trading entries.

Come 11am EST, we get to the bridge of the song. That is when we do not want to trade. The stock will have a choppy erratic dissonance melody. The minions have taken over. Those are the head traders at Goldman Sachs assistants and interns. They get paid to stop out all of the orders on the board while their bosses go out for lunch.  They thrash the market up and down and get paid well to do it.

The best part of the song is the last chorus. I think that is the best time to enter a swing trade. The song has been building with momentum all day long. If the stock closes strong with above average volume, it makes for a great overnight swing trade.

The market plays on eighth notes. This was very clear to traders when the market was trading in fractions. Most stocks had 1/8th spreads. Now that the market trades on decimals, most traders are not aware that it is still trading on 1/8th’s, but guess what? It still is!

Look below at this daily chart of $BAC and you will see how many of these candles stopped right at the 1/8th levels. You will also note that on this chart on the right side, you will see all the price levels are in 1/8th’s. The market also trades on 1/6th levels and ¼’s and ½ notes.

Like music, timing is everything. If you skip a beat and enter at the wrong time, it is not going to sound very good. You will be caught off rhythm and get stopped out while the band plays without you.

I would love to help you learn more about how I trade the markets and take advantage of the Dark Pools for consistent results. Make sure you mark your calendars and come hear my presentation during the upcoming Women In Wealth workshop on October 7-8.

ABOUT THE AUTHOR


Author: Stefanie Kammerman
Company: The Stock Whisperer
Website: TheStockWhisperer.com
Services Offered: Trading Education, Trade Room, Alerts
Markets Covered: Stocks, Options, Futures, Forex, Cryptocurrencies


Chapter 07

Wednesday | October 7th | 4:00 pm ET

Anka Metcalf | Trade Out Loud

Generate a Six Figure Income Trading Futures

  • The advantages of trading futures vs. stocks
  • Reliable blueprint for finding consistent winning trades
  • Simple strategies that generate above average gains

In this article, I will share why Day Trading Futures is a powerful income source for the astute trader.

I will lay out why I prefer to day trade the Futures markets versus Equities market, and how you can turn a small savings into real wealth with Futures day trading.

Low Start-Up Cost

One of the reasons why many traders are attracted to Day Trading Futures is the minimal start-up cost.

For example: it usually requires approximately $30,000 to open a stock day trading account and you must maintain a minimum of a $25,000 balance in order to keep your day trading status. The Futures market allows you to open an account with a minimum balance of $5,000 and you do not have to maintain that amount. As long as you have sufficient cash in your account to cover the margin requirement to trade the Index or Commodity, you can have a balance of $1,000 and still have the ability to trade Futures.

Leverage 

A significant reason why traders move to trading futures is all about utilizing leverage. Leverage allows a trader to maximize their capital.

For example: An individual trader with a small account is allowed to participate in the Futures market more easily than using a cash account to purchase a stock. A trader will need approximately $5,000 to manage a Futures position that controls an equivalent of a stock position of $80,000.

Leverage can have its advantages as well as its disadvantages. The experienced Futures trader understands the discipline required for a stop loss. A trade should result in only four outcomes: large wins, small wins, break even, small loss.

Tax Advantages

There are numerous advantages to select futures as a trading venue for active traders. One advantage is the possibility of lower effective income tax rates and simplified reporting on your tax return.

Another advantage is Futures contracts fall under the 60/40 rule, where 60% of gains are treated as long-term capital gains and 40% are treated as short-term capital gains (ordinary income) - regardless of the actual length of the holding period.

An additional advantage with trading Futures is the ease of year end filing.   At the end of each year, futures brokers send a futures client a 1099-B form. This tax form reflects the net result of all trading versus each individual trade. This number is entered on the tax return (compared with stock trades where each individual trade must be entered).

A full time futures trader may have tax benefits with trader tax status from the IRS.

Markets open close to 24 hours/day 6 days/week

The Futures market permits it participants to take advantage of price action outside of the New York Session (9:30 AM – 4:00 PM EST).

For example: geopolitical events do not wait for the market to open – events happen…therefore Futures traders can react as these events occur.

Many markets that affect the US stock indexes trade outside US market hours.

Fees and Commissions

Commissions on future trades are very low and are charged when the position is closed. The total brokerage or commission is usually as low as 0.5% of the contract value. However, it depends on the level of service provided by the broker. An online trading commission may be as low as $3.00 per side.

Liquidity

Not all Futures markets are created equal. When it comes to day trading the trader should focus on a market that is liquid. A good example of a liquid market is trading the:

  • E-mini Dow 100,000-300,000 contracts per day
  • E-mini S&P 1-3 million contracts per day
  • E-Mini Nasdaq: 200,000 - 600,000 contracts per day
  • Commodities (Crude Oil approx 800,000 contracts/day
  • Gold approx 300 contracts/day)
  • Bonds (30 Year Treasury Bond) 300,000-600,000 contracts per day

The advantage of the Buying Power

For example: 

If a trader wants to day trade the QQQ  priced at $280.00 the trader needs over $14,000 to buy 100 shares

If the price goes up $0.50 you profit $50.00

Each $0.01 = $1.00

If a trader wants to day trade the E-Mini Nasdaq (/NQ) priced at $11,400 the trader needs $17,000 to buy 1 Contract (BECAUSE OF THE 2020 PANDEMIC VOLATILITY)

If the price goes up 50 points you profit $1,000

Each point = $20.00

We did an experiment to show you the difference between trading stocks and futures is from the buying power and results stan point.

We took 2 trades at the same time based on the same technical pattern and set-ups. 

For this example we used the QQQ (ETF) and /NQ (emini Futures)

Trade Number 1:

QQQ long based on a technical 15 min buy set-up with confirmation.

The trade triggered  at 10 AM EST (Exact timing for reversal)

Buying  power used $14.000

We exited the trade into target with profit

With the $14,000 buying power we enter the trade with 100 shares

Realized profit $73.00

Trade duration: 20 minutes

Trade Number 2:

/NQ  long based on a technical 15 min buy set-up with confirmation.

The trade triggered  at 10 AM EST (Exact timing for reversal)

Buying  power used $17,000

We exited the trade into target with profit

With the $14,000 buying power we enter the trade with 1 contract 

Realized profit $600.00

Trade duration: 20 minutes


The choice is clear

If you had a $20,000 account would you rather trade the QQQ and make $73.00 in 20 min or trade /NQ and make $600.00 in the same amount of time?

Come see me during my live presentation at the Women In Wealth workshop on October 7-8, and I will share my favorite strategy for trading the open of the New York Trading Session!

ABOUT THE AUTHOR


Author: Anka Metcalf, Founder
Company: Trade Out Loud
Website: TradeOutLoud.com
Services Offered: Trading Education, Coaching, Futures, Stock and ETF Signals
Markets Covered: Futures, Stocks, ETFs, Day Trading, Swing Trading

Chapter 08

Wednesday | October 7th | 5:00 pm ET

Carolyn Boroden | The Fibonacci Queen

Advanced Fibonacci Time and Price Analysis

  • Using Fibonacci price clusters to spot profitable trades
  • Benefit of applying Fibonaccis to the market’s time axis
  • The best way to make money with Fibonacci analysis

The markets can be very tricky to trade, but I have found that if you take the time to carefully build a trading plan, and then stick to that plan, that this may significantly increase your consistency and confidence on how and where you enter and exit the markets. 

In this video, I share with you my Suggested Day Trading Plan and how I make money on the support and resistance levels I see in the markets. In addition, I explain how I use a simple formula to determine if I should get in the market, and techniques for managing the trade once I get a fill.  

I will be covering this in much more detail during my live presentation at the Women In Wealth workshop on October 7-8.  So, mark your calendars and plan on catching my presentation.

SHORT VIDEO PRESENTATION: ADVANCED FIBONACCI TIME AND PRICE ANALYSIS

ABOUT THE AUTHOR


Author: Carolyn Boroden (The Fibonacci Queen)
Company: Simpler Trading
Website: ElliottWaveTrader.net
Services Offered: Premium Nightly Videos, Fibonacci breakout Room, Fibonacci Member Webinars
Markets Covered: Stocks and Options


Chapter 09

Thursday | October 8th | 10:00 am ET

Hima Reddy | HimaReddy.com

Women in Racing - Momentum for the Win!

  • Catching market turns to ride price waves up and down
  • Finding optimal momentum in only a few minutes a day
  • Picking the best trades, entries, and high profit exits

The best way to achieve consistency in trading is capitalize on momentum. I’ll show you how to amplify the power of a commonly used, but often overlooked momentum indicator.

Chances are, when it comes to using indicators, you're probably doing it wrong.

I’m going to draw from my 20+ years of experience as a technical analyst, and walk you through the best way to set up and use your indicators.

You will learn to dump the default parameters on one of the most commonly used indicators, and fine-tune it to capture momentum on any market, and on any time frame.

First things first. I need to make sure you understand what momentum IS before I teach you how to optimize it. So, let’s start with a simple illustration of how price and momentum work together.

Let’s head to a racetrack, and put ourselves in the driver’s seat. You’re at the starting line of the track, you rev up your engine and you go!

You pick up speed really quickly (or accelerate) on the straight runs. You see a turn coming up, and you prepare accordingly.

You ease off the gas to slow down (or decelerate), even if it’s just a little bit, so that you can have more control as the car whips to the other side of the turn.

Then, after you make the turn and the road straightens out again, you hit the accelerator once more.

Do you get the idea of how you’d accelerate and decelerate on this track? Well now you know exactly how price momentum works!

Let’s jump into the helicopter that was looking down at the racetrack and get a birds’ eye view of it.

The racetrack becomes price as you see it on your stock charts. And momentum (whether as an index or an oscillator) is generally plotted on the bottom as a sub chart.

When price is trending higher, you’ve got upward momentum that’s improving.

That upward momentum generally begins to slow down and peak before price does, making momentum a leading indicator.

During a trend of decreasing prices, there’s falling momentum that is becoming more and more powerful.

But when a price bottom is approaching, you usually see momentum bottom first.

Therefore, momentum indicators can warn you about hidden strength or weakness, giving you a heads up especially when it comes to potential market turns.

Now you might be wondering, what’s the best way to use momentum to boost your trading?

Join me during the upcoming Women In Wealth workshop to find out!

ABOUT THE AUTHOR


Author: Hima Reddy
Company: Hima Reddy
Website: HimaReddy.com
Services Offered: Trading Education, Futures, Stock and Options Alerts
Markets Covered: Futures, Stocks and Options


Chapter 10

Thursday | October 8th | 11:00 am ET

Sarah Potter | YouCanTrade.com

Ways to Buy Call Options with Efficiency

  • Discovering ways to identify the probability of a trade
  • Identifying which stocks may be ready to move
  • Streamlining how to determine which options to buy

If you are like me, one of the things we value most is time. Time for family. Time for work. Time for ourselves. And, that goes for trading as well. Let's face it, no one has the time to sit in front of a screen all day.  It's not productive and just wastes time ... time we don't have.

In this short video, I share a great way I've learned to be more time efficient in my trading activities. I mostly trade options, and love to buy call options on the SPY. I have a routine that helps me quickly understand what the market is doing, and allows me to set up my call option trades a week in advance. Using this technique, I keep a low risk profile, and have significantly improved my trading efficiency. 

Come see me at the Women In Wealth workshop on October 7-8 to learn more about all the efficient ways you can manage your time and setups trading options. 

SHORT VIDEO PRESENTATION: WAYS TO BUY CALL OPTIONS WITH EFFICIENCY

ABOUT THE AUTHOR


Author: Sarah Potter
Company: You Can Trade (a TradeStation Group Company)
Website: YouCanTrade.com
Services Offered: Trading Education, Stock and Options Alerts
Markets Covered: Stocks and Options

Chapter 11

Thursday | October 8th | 12:00 pm ET

Mary Ellen McGonagle | MEM Investment Research

Uncovering Best Outperforming Stocks

  • 4 characteristics of stocks poised to trade higher
  • The one key element found in big winning stocks
  • Simple technique for screening top stock candidates

This short video reviews how to drill down to uncover top candidates that are poised to outperform the markets. The concepts that are introduced are based on a proven system that was developed following many years of researching the common characteristics of winning stocks.

In addition to learning how to spot top stocks, you’ll uncover how to pinpoint your entry point by buying these winning stocks as they pullback to key areas of support.  Even more important, this video covers how to exit the stock so that you retain your profits and limit your losses.  There are many examples that are reviewed in detail to help you in your trading.

THE MOVIE: HOW TO SCREEN FOR TOP CANDIDATE STOCKS

ABOUT THE AUTHOR


Author: Mary Ellen McGonagle, Founder
Company: MEM Investment Research
Website: MEMInvestmentResearch.com
Services Offered: Market Analysis, Market Reports
Markets Covered: Stocks, Options, Futures


Chapter 12

Thursday | October 8th | 1:00 pm ET

Marina Villatoro | The Trader Chick

The Power of the Breakout Trade Setup

  • Understanding what drives market movement
  • Best indicators for spotting market entries and exits
  • How to spot and profit from a breakout trade

What are support and resistance areas, and how can you use them in conjunction with breakouts?

Support and resistance areas are so simple, yet difficult to fully grasp. They will play a HUGE role in how you read the market and once you start to trade.

Since the markets are ruled by people’s emotions, certain price points make people hesitate for whatever their reasons: panic, fear, greed, indecision – we will never know what the reasons are, nor should we care. What we do need to know is that these areas are formed and we need to trade accordingly.

These two areas, in particular, get revisited over and over again until they either break or completely change the direction of the market.

What We Will Learn in This Section

  1. How to spot Resistance Areas (the ceiling)
  2. How to spot Support Areas (the floor)
  3. Channeling Market – wide and narrow – can we trade a channeling market?

What is a Resistance Area?

Resistance areas, the ceiling, are always on top whenever you have an uptrend and it can’t break through a certain price point. This usually means that there are more sellers in the market pushing the price to go down. This area will get hit multiple times around the same zone. It doesn’t have to be precise.

Rule of Thumb – to make it an area – it must be hit at least 3 times.

A strong resistance area changes the direction of the trend. 

It will eventually become a downtrend. It is formed because the buyers and sellers are battling it out and eventually the sellers do win out. However, you never know and shouldn’t trade into your speculation but wait for confirmation – ALWAYS WAIT FOR CONFIRMATION.

A resistance area can also be called a ceiling. The price is hitting against the ceiling over and over again.

How to Draw a Resistance Area

The most important thing to remember when drawing these areas is not to be exact, it can be within one point or where the majority of the pivots hit.

Resistance areas can move. They can start off in one place and then have a bit higher parts or lower. It’s all about encompassing all the pivots. You work with the area, it’s not exact.

What is a Support Area?

The Support Area (floor) is always on the bottom whenever you have a downtrend and it hits a certain price point over and over again. This means that the buyers are winning over and putting the pressure on the markets to go up.

A strong support area will stop the down trend and this is where an uptrend starts.

You do NOT need to have a big downtrend.

Support areas can be called a floor, where the price hits over and over again.

Rule of Thumb – to make it an area – it must be hit at least 3 times.

How to Draw a Support Area

The most important thing to remember when drawing these areas is not to be exact, it can be within one point or where the majority of the pivots hit.

Support areas can move. They can start off in one place and then have a bit lower parts or higher. It’s all about encompassing all the pivots. You work with the area, it’s not exact.

Channels

Channel --  the area between a resistance area and support area.

It is an area where the market is bouncing back and forth.

Channels can also be large consolidation areas for strong trends or transition areas.

You can have wide channels that have oscillating markets within them, meaning there are distinct trends that are trad-able.

But usually channels, for intraday traders, are usually more narrow and are not good to trade.

Breakouts

What are breakouts?

Quite simple it’s when you have a strong area that the market keeps on hitting, or as we say – respecting – and it finally breaks through.

If the breakout is strong, this could be a great place for a high probability trade, in any market.

What we learn in this section:

  1. How to spot valid breakouts
  2. The except to the rule – Fake out break out

How to Spot Breakouts

Breaking Support / Resistance Areas

No matter how long a resistance/support area holds (can be minutes, can be hours, can be days) it will break.

It is super important that you do not speculate and assume where the break will happen, because you really never know.

Once the break happens the market can revisit, pullback to the area, several times again. It’s not necessarily a strong area yet, but it is an area we need to be aware of.

Confirmation – this comes when the area is broken with serious strength (strong movement). This is what we like to see before considering entering into a trade in either direction.

Important note – a lot of times the support or resistance area once it’s broken can turn into a resistance/support area – this does not mean it will become a strong area, but is definitely an area that is revisited and good to keep an eye on.

ABOUT THE AUTHOR


Author: Marina Villatoro, Founder
Company: The Trader Chick
Website: TheTraderChick.com
Services Offered: Trading Education, Boot Camps, Trading Community
Markets Covered: Futures, Equity Indices and Commodities


Chapter 13

Thursday | October 8th | 2:00 pm ET

Dr. Julie Manz | TraderInsight

Psychology You Need to Trade Successfully

  • Find out if you have the mindset to master the markets
  • 4 content areas to help jump-start your trading business
  • Techniques for achieving the optimal psychological edge

Trading stocks online is a dynamic choice for men and women alike. While it is not marketed to women as often as men, it is an equal opportunity profession. In the 23 years I have been trading, I am always surprised more women aren’t drawn to our style of trading intraday. I am a fierce advocate for the freedom this unique form of income can provide to anyone who puts in the effort. 

Online trading attracts people who have an entrepreneurial spirit. There is no boss, no employee, and no one else to define your efforts. You don’t need to consult with a broker who might add an extra layer of decision and confusion. It doesn’t have specific prerequisites and relies entirely upon the effort and learning put in. It can be executed from anywhere with reliable internet or even, in a pinch, cell service with a hotspot.

With the world turning more and more to businesses operated outside of an office setting, and to businesses that are more self-determined, trading your own account intraday offers a perfect solution. In its simplest form, “day trading is the practice of profiting from intraday moves in the equity market and closing all positions by the end of the day” (La Bier). This means that every day is a discrete and complete project, and as such, can be done every day or only on days the trader is available. Flexibility is key.

This makes intraday trading ideal for entrepreneurs with busy schedules, many of whom tend to be women. As women, we excel in multitasking. As a married trading team, the way Adrian & I trade - actively for the first hour and then on autopilot through software the rest of the day - is very attractive for anyone who cannot or does not want to be in front of a screen all day. And for multitaskers, our style is a godsend.  We are able to start and complete an income activity in the course of 30 to 60 minutes and move on with the rest of the day.

 But where to start? There is so much information out there - how do we sort it in a meaningful way?

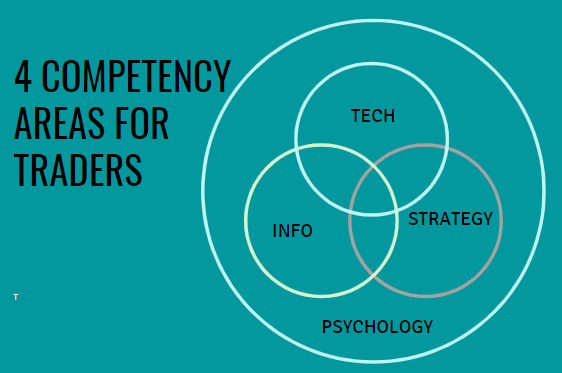
When I consult with traders, men or women, who want to add intraday strategies to their repertoire of trading, I start with an acronym I developed. I use it so traders can pull apart the interwoven pieces of four major content areas and examine them independently. Different people have different challenges, strengths, and experiences, but everyone can wrap their arms around this framework.

I like to think of these as four boxes or as four circles of a Venn diagram. Each of these four content areas is an essential element with some overlapping parts. And even though almost everyone immediately heads to Strategy, the largest circle encompassing the rest is Psychology

Most talks/books/articles out there center on strategy.  Why?  Because that is really what we all want, right? “Cut to the chase scene, give me the shorthand . . . What do I trade and how do I trade it to be successful?”  

And that is a huge part of successfully trading your account intraday.  Strategy is undeniably necessary for achieving success. It is like the vehicle for getting “there,” and without it, you won’t get far. But there are other things you will need, like a road on which to travel (Technology), knowledge of how to operate your vehicle, signs on the street, etc. (Information) and finally, the fuel (Psychology) that makes it all move.

Without each of these elements working together at peak performance, you cannot succeed in day trading. All dimensions have to be top shelf, and psychology is rightfully an equal part of that equation, if not more. Let’s do a quick overview of each piece.

 TECHNOLOGY

The most straightforward of the four is technology. I hope that anyone looking to trade from a personal computer understands that the equipment should be state of the art. As computers can have different strengths, what you need is the best gaming machine for maximum effectiveness. Why? Because the graphics card needs to be top-notch to handle the charting and video throughput that most trading software employs.

But a fantastic trading computer is only the beginning. In addition to great hardware, you need to consider your internet - both speed and connectivity. Also, you will be using software in the form of a broker and trading software, or a combined broker/software platform. All of these can contribute significantly to your success and ability to trade quickly and effectively. The type of technology you have is critical when creating a technology-based business.  

INFORMATION

There is a lot to learn when starting any new business. Whether you plan for this to be primary or additional income, I always recommend approaching your trading as an entrepreneurial  endeavor. You need to take it seriously and keep records of the decisions made and costs associated with each step. Make sure to track spending for hardware, software, commissions/services, and materials and the profit and loss associated with the trading itself.

But there are so many other things to know, and each person has different levels of what they already know. Here is where there can be a gender-gap, with more young men than young women being talked to, marketed to, pushed to learn about the stock market; what it is, what it isn’t, and how it works. Luckily, this is a small gap, and it is entirely knowable information! If we talked about making it in the corporate financial world, it would be a different conversation, as witnessed by the fanfare associated with the first woman anointed to run a top Financial institution (CitiGroup starting in 2021). But that is not this conversation. Run with this! 

Learn like you are back in school. Study the markets, how the system works, understand your technology/trading platform, know exactly how to execute trades, and become expert in the type of trading you are doing. Learn about the sectors you may trade, watch or read market-centered news, and avoid the cable-tv fluff. Start to understand that the Markets were not initially set up for you or for me (retail clients) but for institutions to raise money for institutions to expand their businesses. Figure out how you fit into this and know that it isn’t a savings account and that your profits are not guaranteed. We trade intraday specifically because we can control when and how much of our money is in the markets - and we can keep learning.

PSYCHOLOGY

Plan the Trade, Trade the Plan has been our motto since 1997 when we started trading as graduate students. As two Psychology students working toward our Ph.D’s, we knew better than to fight with our thoughts and emotions in real-time during a trade. There is too much pre-programming going on that wasn’t designed for trading. We also realized that we couldn’t build a trading business by hanging on the outcome of every trade individually. That is a roller coaster filled with false, incomplete, emotional information. Just like baseball, there is no such thing as actually batting 1000. 

The solution to many biases, heuristics, unconscious and instinctual programs that endlessly run through our human brains is simple: have a trading plan and following that plan. When you know you have an effective method, only tally the results once a week, or even every other week. Take the P&L off your screen while you are in the trade and focus only on the levels or chart patterns in front of you.

I find, after nearly two decades trading personally and a decade working closely with Mastermind Students, that the essential characteristics of successful traders include having:

  1. A plan they intend to follow.
  2. A passion for trading. 
  3. A willingness to self-monitor with a growth mindset. 
  4. Patience and self-compassion.
  5. A sharp focus that ignores background emotions. 

Of course, as with most skills, there is no substitute for experience. Those new to any style of trading should practice with simulators and in real-time, not with real money. Scientific research and the veteran-trader opinion I have gathered support these areas as ones that foster success and longevity. 

How to achieve these characteristics depends on your personal psychology and then which of the many psychological approaches (cognitive/behavioral, humanistic, biological/evolutionary, etc.) are best suited to you. This is a much larger topic than can be adequately addressed in this chapter, but we have assessments we use to help traders understand where they are and work with them to become confident, competent, successful traders.

 STRATEGY

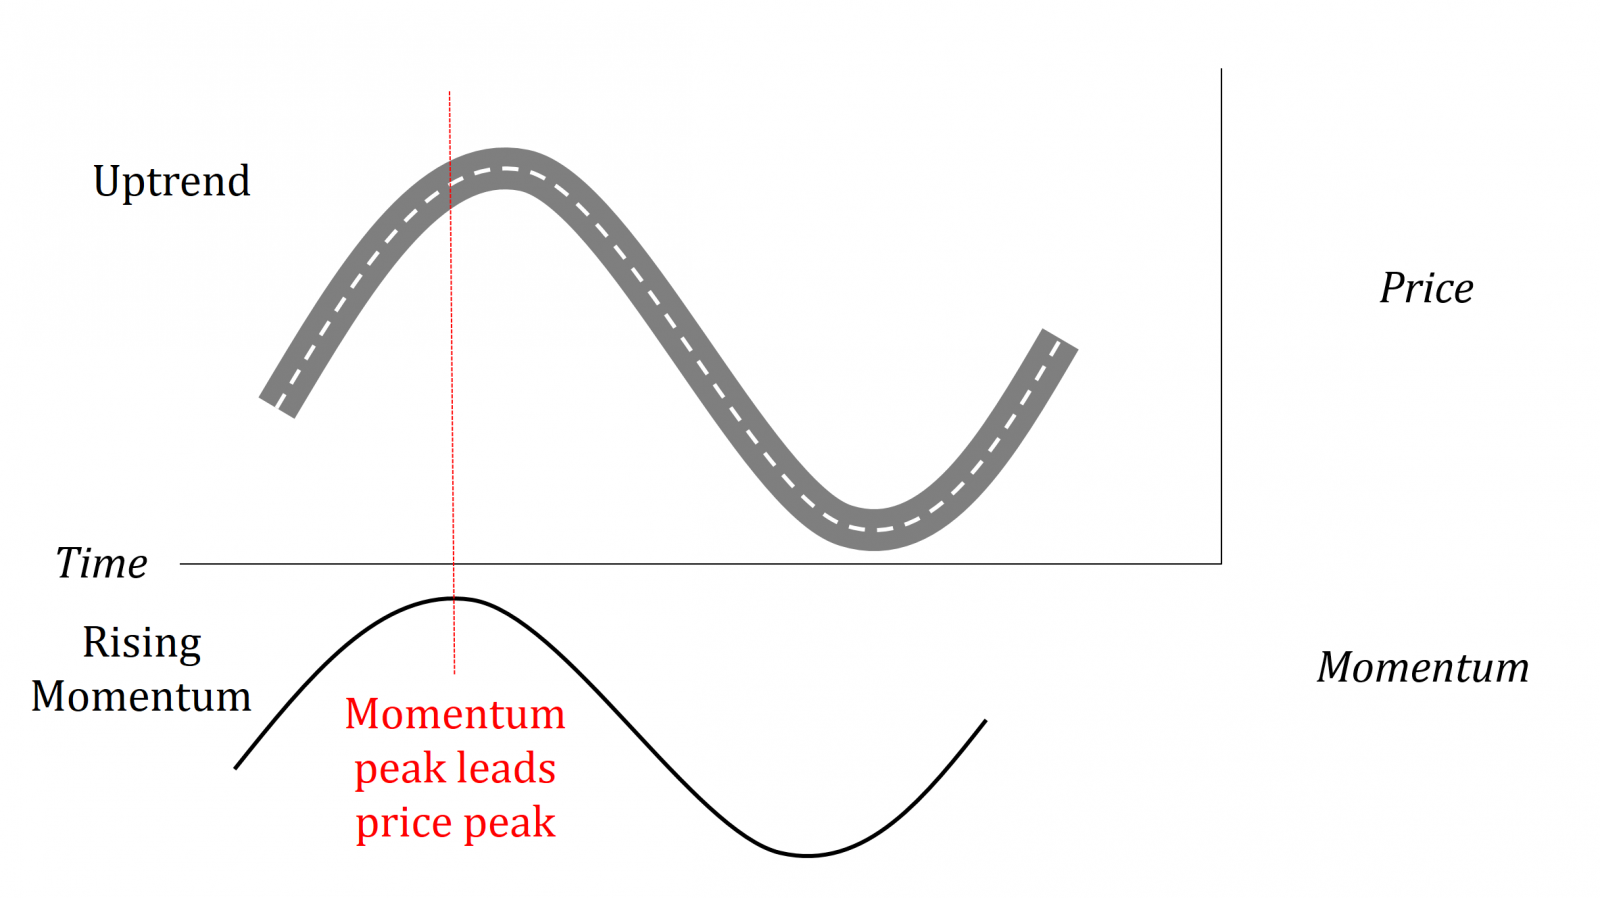
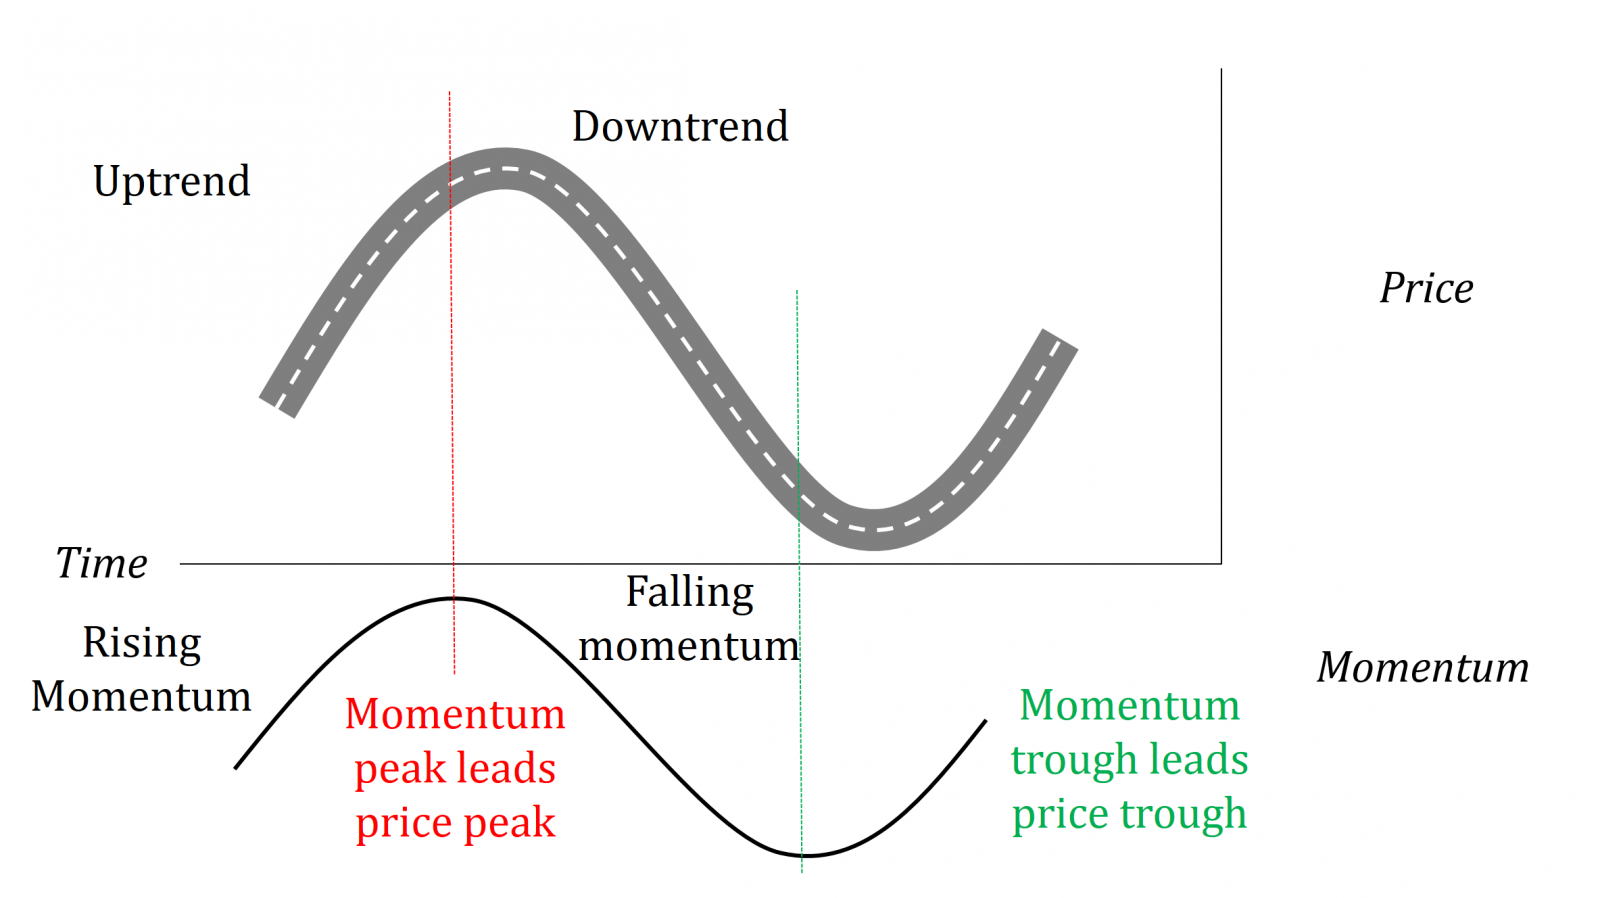
Over the years, Adrian developed effective, targeted trading strategies that work for his psychology. I modified the management of these to suit my psychology, and we are well in sync with one another. While his suite of intraday strategies has continually developed and adapted to market conditions, the original set of patterns he developed has remained the same because, from the start, he accommodated market cycles. 

I mention this so that whatever strategy you end up developing or following, it needs to be able to adapt to market conditions. Darwin's theory of survival of the fittest is misinterpreted as a survival of the strongest, or sometimes misquoted as “only the strongest survive.” The real meaning of the “fittest” is the most adaptable. We also like the aphorism of Heraclitus: No person ever steps in the same river twice, for it’s not the same river and s/he’s not the same person.

Trading is very much more like sailing a boat. You have your ship, you know how to operate its instruments and masts, you have your course set, but both the sea and wind conditions change frequently, and you need to accommodate to the conditions.

Another consideration when choosing a strategy is whether you are a hunter or a trapper.  Adrian and I are trappers.  Adrian has four main intraday strategies.  All of them are pre-planned, systematic and replicable.

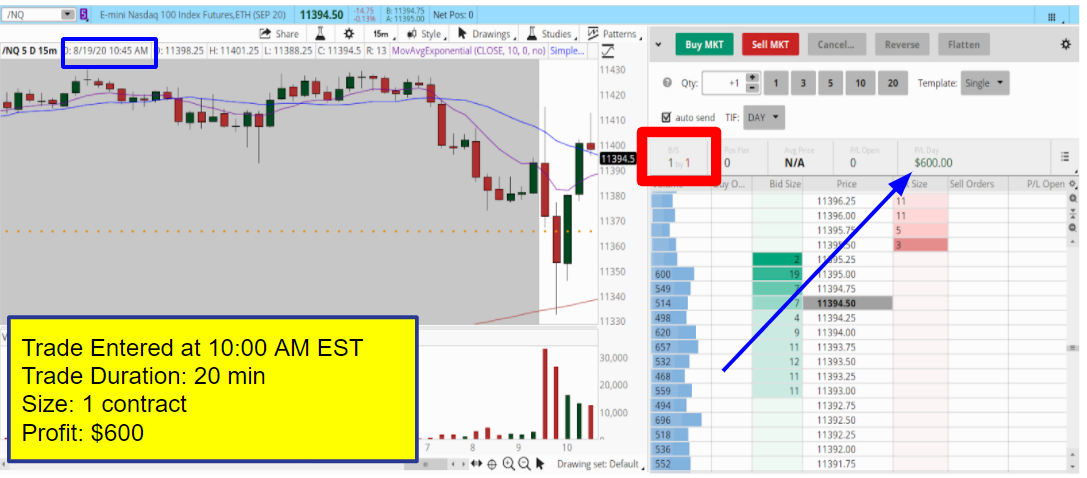
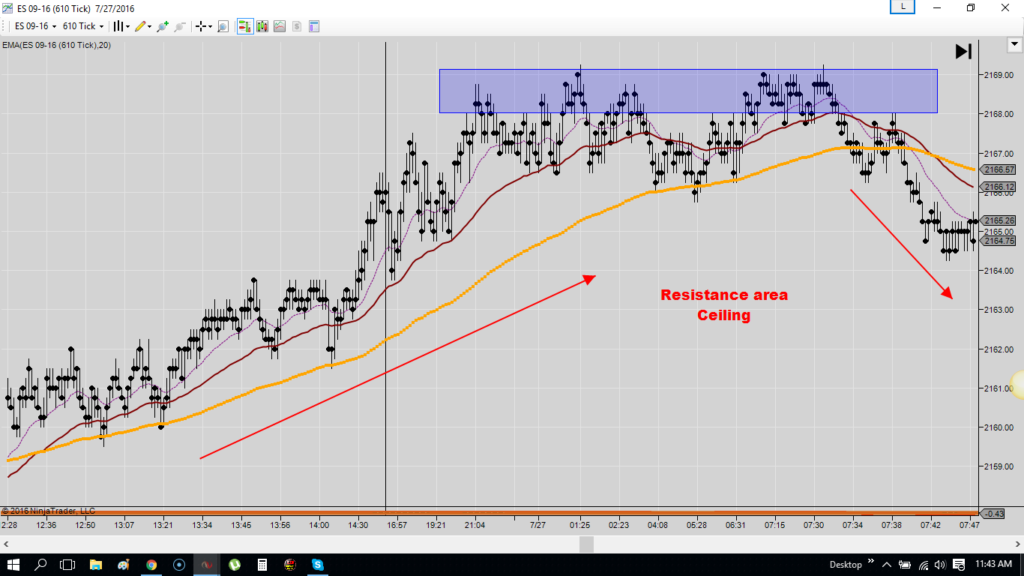
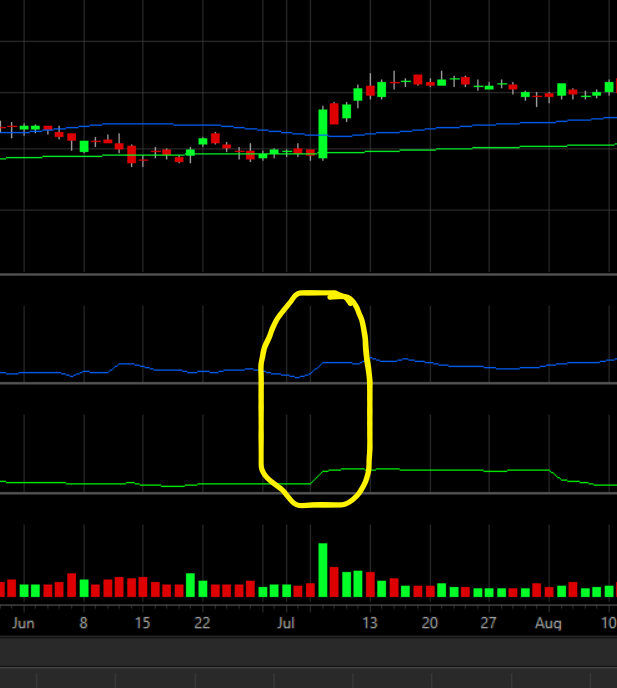
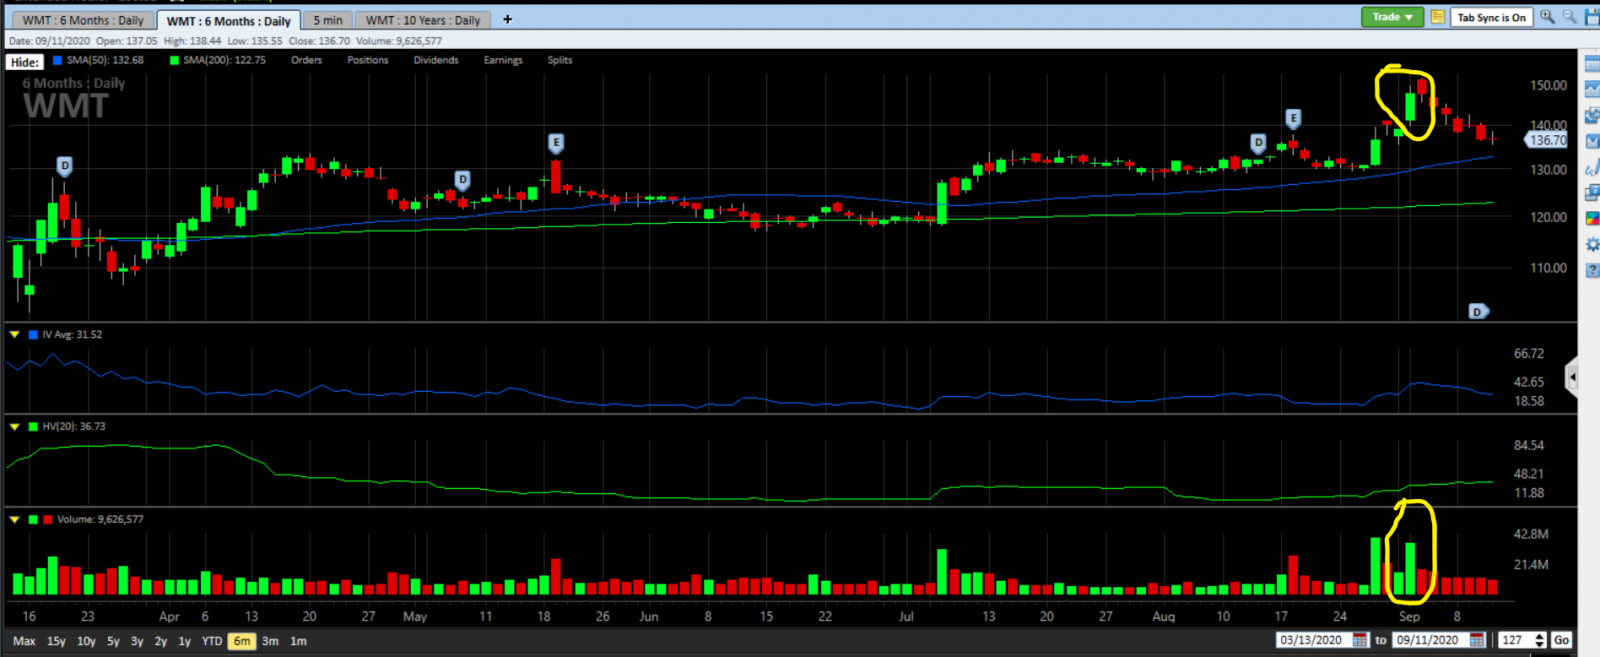
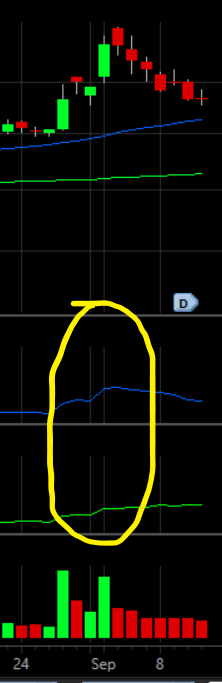
One technique that many women I work with like very much is our Volatility Band trade  This strategy mirrors the activity of the prominent market programs and is explosive.  It require full concentration and impeccable order entry skills. Still, the pace and adrenaline associated with the execution tests our skills and encourages us to become more proficient every trading day. This is something every trader I know relishes.

This is a viral strategy for a few reasons:

  1. It can be traded on days convenient for the trader, and each day is independent of the next.
  2. It is very liquid with a lot of volume so that traders can start with a small share size (1 to 50 shares), and when they achieve success, they can increase share size to improve outcomes.
  3. It can be traded in long-only accounts
  4. It can be traded only twice per week and not exceed the Pattern Day Trading limits.
  5. It generally can be completed in under an hour and traded during different times of the day, at the open or later when it begins trending

That is just one example of a strategy that works for busy entrepreneurs. I believe that all traders, men, and women alike, can benefit by adding intraday trading to what they already do. By remembering the TIPS components, you can jump-start your trading. Just make sure that the strategy you choose adapts to market conditions, has straightforward entry and exit rules, and that it works with your psychology.

ABOUT THE AUTHOR


Author: Dr. Julie Manz
Company: Trader Insight
Website: TraderInsight.com
Services Offered: Trading Rooms, Trading Courses, Special Events
Markets Covered: Stocks, Options, Futures


Chapter 14

Thursday | October 8th | 3:00 pm ET

Anne-Marie Baiynd | TheTradingBook.com

Using Trading Levels to Manage Risk

  • The most important process a trader will ever learn
  • How to identify key support and resistance levels
  • Roadmap for determining quality entries and exits

If you are learning about support and resistance levels and want to know how to trade them, this is a simple technique that I use every day.  How we use our trading levels is simple and highly effective ... as you know what to look for and what to do with them.

Come see me at the Women In Wealth workshop on October 7-8 to learn more about my strategy for using support and resistance to trade the markets with improved confidence and consistency. 

SHORT VIDEO PRESENTATION: USING TRADING LEVELS TO MANAGE RISK

ABOUT THE AUTHOR


Author: Anne-Marie Baiynd
Company: The Trading Book
Website: TheTradingBook.com
Services Offered: Trading Education, Stock and Options Alerts
Markets Covered: Stocks and Options


Chapter 15

Thursday | October 8th | 4:00 pm ET

Licia Leslie | Option Pit

Shopping for Cheap Options

  • How to use options to go shopping - designer shopping
  • Learn a simple trick that will make trading options easy
  • Why trading options can support your family for life

As women and as traders we love getting a GREAT deal, don't we?  We love when we can purchase those Valentino shoes or that Gucci handbag we’ve had our eye on...on sale!

This way we don’t feel like we are getting ripped off by paying full price. 

Well, I’m here to tell you as living proof, there are ways to profitably make money from the stock market without making a huge investment or paying “full price.” 

In order to better our families’ lives, by taking control like we do in everything from our kids to our homes, I’m going to show you one simple trick I use to trade stock options to support my family.  A trick I learned in the “pits” of Chicago so long ago...as the only woman to ever break into the original infamously harassing Citigroup crowd.

Before you think it's crazy to use options to change your life, take it from a woman who literally has been there going toe to toe with the men at their own game…

It is NOT hard!

You see, in the past people regarded options as something too “risky” or even too complicated to learn. Guess what, even women can trade options! Haha!

But here's the shocking truth no one is talking about - for the first time ever, single stock options volume surpassed stock trading volume AND the average daily value of single stock options has DOUBLED in 2020 as we can see below:

Not only that, the little guy (gal) trading ten contracts or less, has gone from about 32% of all equity option volume two years ago to almost 45% today!  Looks like everybody’s doing it!

Clearly, options are NOT too difficult to learn to trade. With options volumes exploding, they are quickly becoming the new tool to replace stocks. A tool that is cheaper than stock trading, a tool that is less risky than stock trading, and a tool you can learn to use.

There’s never been a better time to learn how to trade stock options. With twelve years of  CBOE pit trading experience, I can teach you how to find those options that are “on sale”. We like to buy options we view as a great deal. I am going to show you how to find those cheap options and make money owning them.

When determining an option’s value we are looking at volatility. The volatility of a stock is the percentage it is expected to move, up or down, on an annualized basis. As traders and as buyers of options, we love volatility.  Volatility provides opportunities for us. We measure the volatility of the S&P 500 using the VIX futures. The VIX is considered the gauge of market sentiment, sometimes called the Fear Gauge. The higher the VIX, the more nervousness is perceived to be in the market. The below graph shows us each monthly futures contract price.  Currently, due to the upcoming election, the VIX is showing us some high volatility in the October contract.

The snapshot below of the VIX futures on September 12, 2016, shows us the  comparison to the previous election of 2016: the market is pricing in a lot of uncertainty for this year’s event. The Sep 2020 VIX futures contract is 26.60 while the Sep 2016 contract was 15.32. The Oct 2020 contract is 31.84 when the Oct 2016 contract was nearly half of that at 16.92!  Meaning the VIX is predicting the market will move twice as much this October than it did in October of 2016, right before that election.

Is it due to Covid 19? 

Social unrest? 

The vast differences between the two candidates? Probably all of the above.

So, we need to go shopping and look for those sales events, i.e. cheap options, options trading at great buying value prices. 

In this environment of high volatility, there are still deals to be had. We find good option buying opportunities by looking at the stock’s volatility and looking at the pricing of the options in relation to each other.

 Let’s take a look at a trade we made in Walmart on July 7th. 

We decided to hop on board this big move up that day; WMT was up over $8.00 trading from $118.66 to $127.99 and the volume on the day was well above average. We bought the Aug21 (regular expiration, which usually has the most liquidity) 130 calls and paid $2.15. You do not need a large trading account to make this trade. We bought 2 contracts which cost a total of $430. 

We can also see that the volatility is increasing. The blue line is the implied volatility of the options and the green line is the historical volatility of the stock. Both are moving higher as the stock is moving higher, an indication that this move should keep going.

We sold these calls the same day for $3.70 making $310, a 72% profit. We could have held onto those calls since we still had a lot of time until expiration, but you cannot turn down a 72% profit made that quickly. Take your money and move on to the next trade! A good rule of thumb.

Another WMT trade we made on Sep 1st. Same idea, the stock had a big rally, after gapping open, trading from $140.10 to $149.93 and again with increased volume. We bought 3 Sep18 145/160 call spreads paying $2.93 for a total of $879. We bought the 145 calls and sold the 160 calls to lower the total cost of our trade. Not only that, the 160 calls were trading at a higher implied volatility of 35 than the 145 calls trading at an implied volatility of 31, our signal that we were getting a “good deal” in buying the 145’s. 

Again, the implied volatility and the historical volatility were moving up:

That same day we sold 1 spread at $5.00 and the last 2 spreads at $6.00 for a profit of $821 or 93%. Just enough money to buy those Valentino Rockstud pumps, on sale, of course! Remember, you have to take your profits, especially if they come that quickly, and move on to the next trade.

Let’s go shopping together!  If you would like to learn more on how to go “Shopping for Cheap Options” join me at this special event Women in Wealth on October 8th at 3:00 PM CT.  

ABOUT THE AUTHOR


Author: Licia Leslie, Director of Operations
Company: Option Pit
Website: OptionPit.com
Services Offered: Trading Education, Training, Trade Room, Newsletters
Markets Covered: Stocks, Options