Chapter 02

The General Blueprint for becoming a million-dollar trader has only two pieces, each having their own set of instructions.
- Generate a small, consistent weekly income using a low-risk option strategy
- Compound that income according to a proper Compounding Plan
This General Blueprint will result in astronomical growth in your account.
Power of Compounding
.jpg)
Let’s first start with the power of a proper Compounding Plan. This is the ONLY thing that gives you the ability to achieve astronomical growth without risking a ton of money. The lower the risk, the more efficient the growth. The results below WILL occur if you are implementing the right kind of strategy. It is simple math.
- $10/Week Grows $1,000 into $35,000 in 5-Years
- $25/Week Grows $1,000 into $211,000 in 5-Years
- $50/Week Grows $1,000 into $845,000 in 5-Years
- $75/Week Grows $1,000 into $1.9 Million in 5-Years
- $100/Week Grows $1,000 into $3.4 Million in 5-Years
To put this in perspective, without the compounding, $10/week grows into only $2,600 in net profits after 5-years (instead of $35,000), and $25/week only grows to $6,500 in profits after 5-years (instead of $211,000).
This is why so many traders completely and utterly dismiss low-risk, high-probability option trades. They are looking for the strategy to make them the big bucks right away, when this isn’t the plan. The idea is to use a compounding plan to grow your account through small and consistent winning trades over time.
Generating a Small, Consistent Weekly Income
While this is a little more complex than simply following a compounding plan, it is, nevertheless, far easier than what most traders make it out to be.
For those who have experience trading options, and specifically diagonal spreads, this may be all the instruction you need. However, if you are not familiar with diagonal spreads, there are “traps” and nuances that need to be understood to make sure you achieve a 98% probability of success on each trade. I’ll briefly cover those in this blueprint, but the more you understand the approach, the more efficient you will be at trading it.
Before I get to the Pattern, let me give you the first goal in the process.
- Close out a $20 net profit with your first trade
When you have a 98% probability of success with a pattern, this is not the ideal way to trade it. However, you’ll go through the entire process (opening, closing) at your choosing as opposed to waiting until the last minute where mistakes can be made.
If you make a mistake, correct the mistake and take another trade (same week or for the following week). Exit that trade at a $20 net profit.
- After you exit your trade at a profit, WATCH the trade to its conclusion
You’ll learn a lot by this process. In fact, the more of these patterns you watch from start to end, the more you are going to understand them. It is a tremendous exercise to increase your efficiency with how you take advantage of this truly unique opportunity.
- Exit your second trade at a $30 Profit
After you have had a successful trade of $20, take your next trade and close it for a $30 net profit. If you make a mistake, correct the mistake, and repeat the effort. After you exit each trade, watch the trade through expiration.
- Rinse and repeat adding $10 to the profit target
After you have successfully exited a trade at a $30 profit target, take your next trade with a $40 target. The following trade at a $50 target. Etc. up to about $100. By the time you get to $100 profit target, you’ll have a solid understanding of the pattern itself and will be able to increase your efficiency with how you exit the trade. Watch every trade you take through the expiration after you exit.
This 4-step process is the safest and most efficient way to implement the Million-Dollar Option Pattern and ensure the smoothest possible start to your journey.
Million Dollar Option Pattern

The concept behind the Million Dollar Option Pattern is very straight-forward and is the most powerful concept in option trading will give you a 98% probability of success week in and week out…if they are executed properly.
- Don’t Start with a Big Trade Size (Stick to the Process)
- Do Not be Reckless in How You Implement the Strategy
- Follow the Instructions
Start small. I don’t care what size of account you have. You will make mistakes at the beginning. You can count on it. The process I have put in place is designed to minimize those mistakes and the cost of the mistakes when they are made. There is huge growth potential as you experience actual success.
If you are reckless in how you implement this strategy, it can be costly. You can’t just implement the logic any way you want and create a 98% probability on a trade.
Follow the instructions. I don’t care how much education or experience you have. Not long ago, I didn’t follow my own instructions, thought I’d change it up a bit to create a small fortune in a single week with a huge probability of success. But to do that, I had to take more risk than I should have and I got bit. The market made a 2% move My loss should have been small, and it was big. The markets don’t care how much experience you think you have. If you don’t follow the instructions, it’s only a matter of time before the market will chew you up and spit you out.
Friday – Monday Relationship
The Million-Dollar Option Pattern utilizes the Friday/Monday expiration relationship in SPY. This is a special relationship that allows for the 98% probability of this pattern. However, there are issues with the Friday/Monday expiration relationship as well, making it imperative that you stick to the process. If you deviate from the process, you could be creating a lower probability of success (sometimes substantially lower).
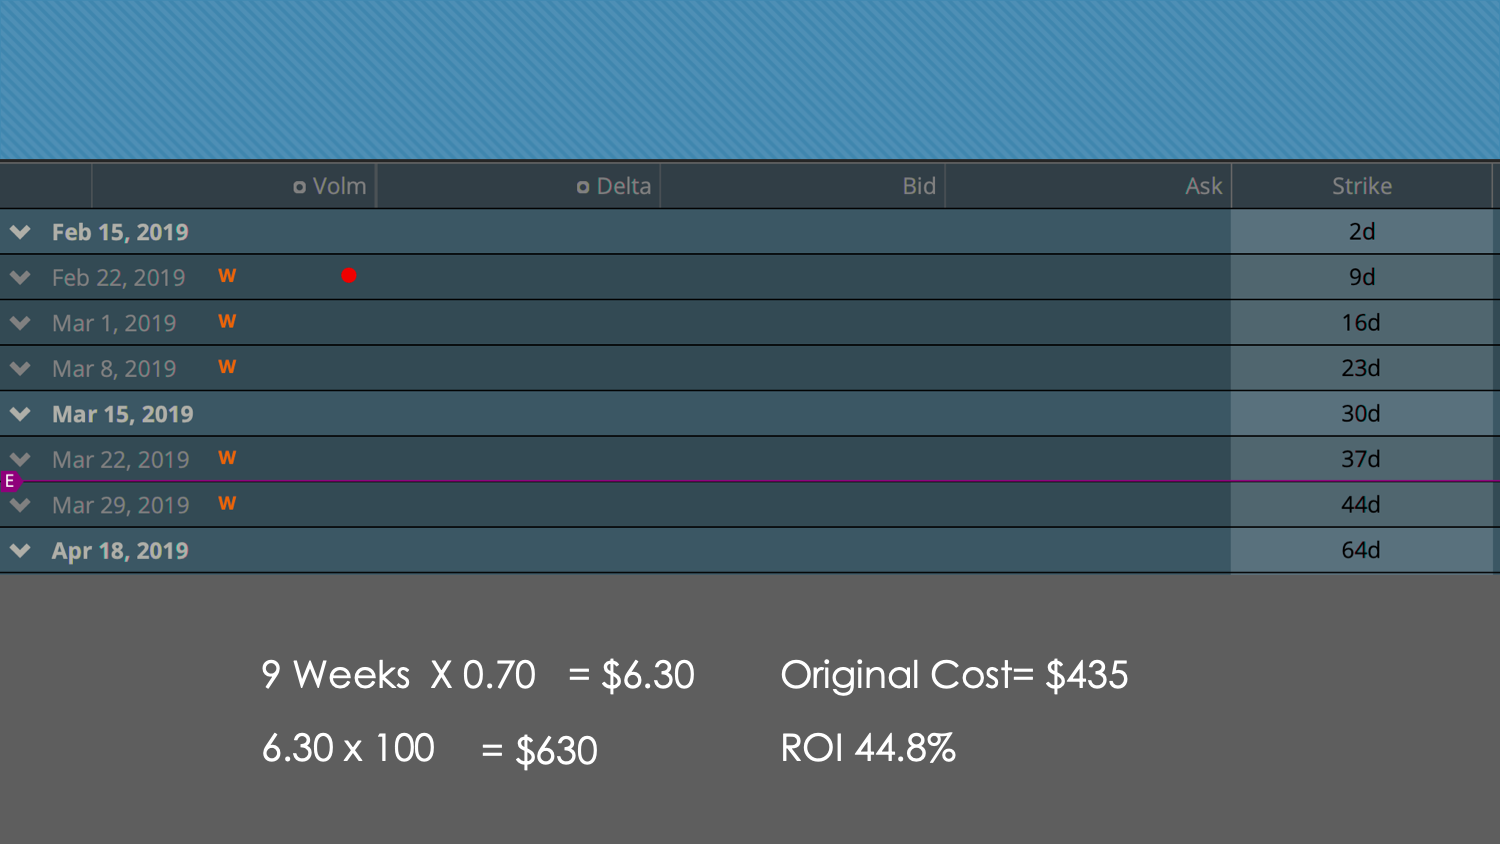
Time Frame for Placing on the Million Dollar Option Pattern
Generally, this pattern can be placed from between 4 – 10 days prior to the Friday expiration leg. The key to being able to place on the pattern is the price relationship between the bearish trade and the bullish trade.
Million-Dollar Option Pattern Concept
The concept is straight-forward and logical:
1 Bearish/Neutral Trade + 1 Bullish Trade = Huge Probability of Success
Here is the “go to” pattern for each of these trades:
Bearish Trade:
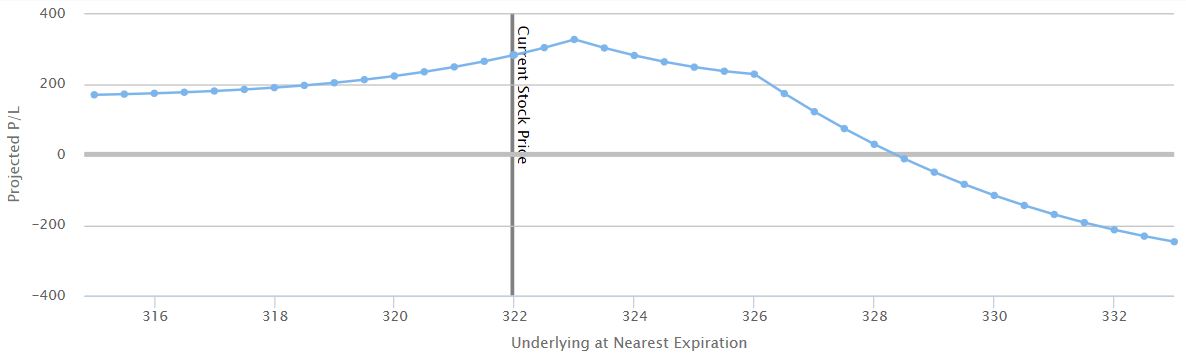
This trade is projected to make money if SPY closes at any level below about 328.00ish. The minimum gain to the downside is $162. SPY was trading just below 323.00 at the time the trade was filled.
The risk on the bearish/neutral trade is almost always going to be the bigger risk between the bearish and bullish trades. The reason for this is due to the “neutral” aspect of the trade. If the market goes nowhere by expiration, this trade will make between $175 - $225. he maximum risk on this trade if SPY sky-rockets AND you do not implement a bullish trade is $338, but has a very low probability or realizing that maximum risk.
Bearish Trade Legs:
Leg 1: Sell (1) Friday Exp Strike Call That is Slightly Out of the Money (or Can be ATM).
Leg 2: Sell (1) Friday Expiration Strike that is 3.00 Points Higher Than the First leg.
Leg 3: Buy (2) Monday Expiration Strike Calls that are 1.00 Point Higher Than Leg 2 Strike.
For a Credit (Usually Above 1.35 in Current Market Conditions)
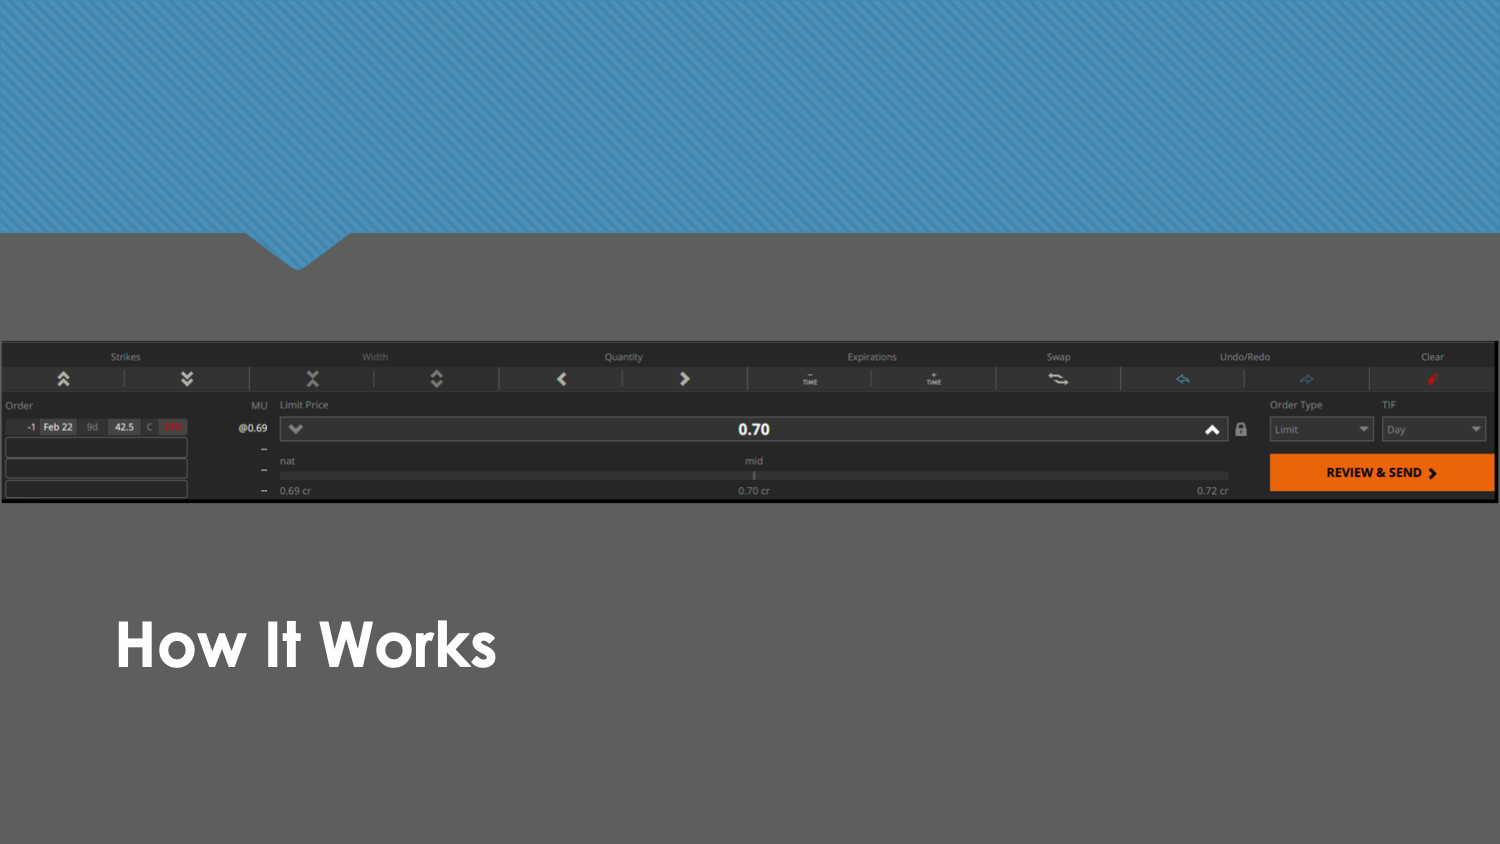
This is the pattern. The strikes with this pattern can move either lower (OTM), or Higher (ITM), but the price at which you buy the spread at is DIRECTLY RELATED to the price of the bullish pattern. The implementation of this pattern is represented in the projection graph above with the details below:
Leg 1: Short (1) Fri Exp 323.00 Call
Leg 2: Short (1) Fri Exp 326.00 Call
Leg 3: Long (2) Mon Exp 327.00 Calls
From a Credit of 1.62
This is not a difficult pattern. Practice understanding the price points of this pattern by watching several of them throughout the week. When placed according to the pattern when the lowest short strike is slightly OTM, there is generally about a 70% probability of success if held on until expiration.
Obviously, as the market moves, the pattern moves with it. If it is Thursday and I place on the trade for the following Friday/Monday expiration (8-days away), and SPY is trading at 322.50, then my first short strike will be 323.00 and the pattern will build from there.
If on Friday and the market is trading at 320.20, I will place my first strike at 321.00 or 320.00, depending on whether I want to bring in a bigger credit or not.
Ultimately, it doesn’t matter whether you place the trade ATM, slightly ITM, or significantly OTM. The KEY is the relationship and price of the bullish trade:
Bullish Trade:
There are several different types of bullish trades that can be placed on. I’m going to keep the bullish trade as simple as possible.
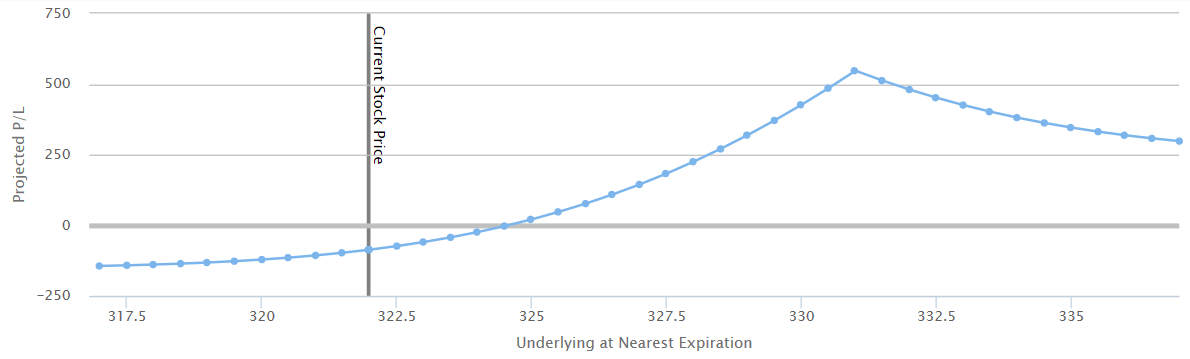
Notice that this bullish trade will lose money if the market goes nowhere. That is fine, the bearish trade will make a significant gain in that instance. If SPY moves higher, there is a profit peak at 331.00 that tops out at around $500. The minimum gain on this trade is $250 if SPY Sky-Rockets. Meanwhile, the downside risk is at $150 if SPY crashes.
Recall with the bearish trade, the minimum gain is $162 to the downside. This means if SPY crashes, you are guaranteed to make at least $12 on the trade. While that doesn’t seem like a lot, $12/week with this strategy compounds into $48,000 in profits after only 5-years.
The details with this trade are below:
Leg 1: Sell (1) Fri Exp Strike Call That is 4.00 Points above the Long Strike in the Bearish Trade.
Leg 3: Buy (1) Mon Exp Strike Call that is 2.00 Points Below the Short Strike of Leg in the Bullish Trade.
For a Debit of 50% of the Credit of the Bearish Trade.
The only slight modification with this trade is that you are going to do 2 of the bullish, not one. So it looks like this:
Leg 1: Short (2) Fri Exp 331.00 Calls
Leg 2: Long (2) Mon Exp 329.00 Calls
For a Total Net Debit of 1.62 or Lower (At or lower than the credit of the bearish trade).
I was able to place this particular trade on at a total debit of 1.50, giving me a credit of 0.12 on the trade. The risk of the bullish trade is the debit on the trade.
If this is your first time putting together option patterns (for most of you it is, as no one else teaches how to do this), you might think it is a bit complex and complicated. You might even be confused.
Don’t worry, that is natural. I promise you, the more you get into this, the easier it becomes. After a few months of putting this trade together, it will become second nature.
Most importantly … stick with the process.
Compounding Plan – Don’t Trade Without It
The Million Dollar Option Pattern is a great pattern, but it is not one that is designed to make a killing week in and week out. True wealth comes only by combining the option strategy with my compounding plan.
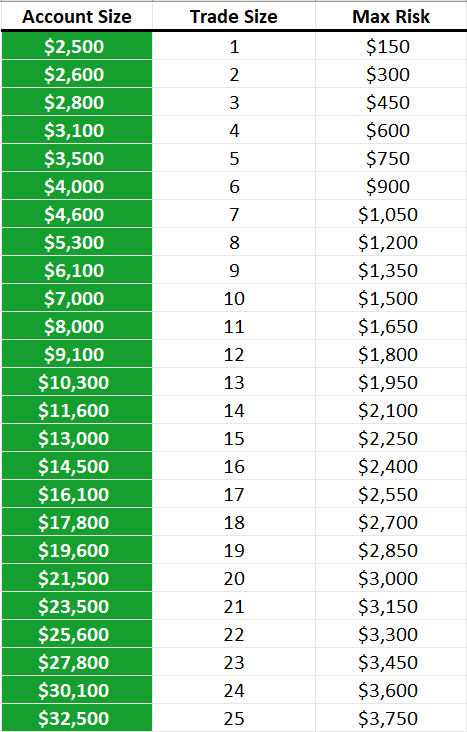
This compounding plan shows starting out with $2,500. That is a good starting account size for this because it allows for mistakes and slight variations if needed. However, you can start with as little as $1,000 in your account.
The combination bearish/neutral trade with the bullish trade is considered 1 Unit in the trade size column. It is a 1/1/2 trade combined with a 2/2 trade.
Two units is a 2/2/4 trade combined with a 4/4 trade. Etc.
Since the risk on the Million Dollar Option Pattern never has a risk of more than $100 if implemented properly, the max risk column should never come into play.
Here is How it Works
When your closed trade account value reaches $2,600 (or $100 in profits), go to 2 units on your next trade. When your closed account value reaches $2,800 (a total of $300 in profits), go to 3 units on your next trade, Etc.
Decreasing:
If you suffer losses either through abnormal market conditions and/or mistakes, you need to drop your trade size as the account drops. Let’s say you reach an account size of $4,000 ($1,500 in profits) and are trading 6 units and lose $50 on the trade per unit. That drops your account size to $3,700. In this instant, you would REMAIN at 6 units. You would not drop down to 5 units unless your account decreased below the previous level (in this case $3,500). At 3,500 or below, you drop to 5 units. You will drop down to 4 units if your account drops to $3,100, and 3 units at $2,800.
Follow the decreasing levels on the way back up, and then resume the normal increase rate according to the plan.
ABOUT THE AUTHOR

Author: Ryan Jones, Founder
Company: Quantum Charts
Website: QuantumCharts.com
Services Offered: Trading Education, Trading Software
Markets Covered: Futures, Stocks, forex
Ryan Jones developed Quantum Charts, a state of the art market analysis, system development & trading platform for stocks, futures and forex using an exclusive drag and drop process eliminating the need for programming skills.


.png)
.png)
.png)


.png)