WestmarkTrading - Return of the Bear Strategies for Uncertain Markets

Chapter 01

Matt Hensley | YouCanTrade

The Five Moves Markets Can Make Each Day

  • There are more than 3 moves the market can make
  • Importance of degree and quickness of market moves
  • Options setups that don’t need a move to be profitable

Chapter
01

The Five Moves Markets Can Make Each Day

By Matt Hensley, YouCanTrade.com

You've heard the markets can only do three things on a given day. Go up, go down, or stay the same. But what about degrees of movement? And what do they mean for potential trades? Join YouCanTrade coach Matt Hensley as he walks through each of the five possible market moves and how he reads them. As a full time options trader, Matt is not only concerned with the movement of an underlying but the degree and quickness to each move as well. He'll also share a quick story from 2020 that shows how market sentiment can change overnight.

In addition, Matt will preview his presentation where he will walk through one of his option trade setups that doesn't necessarily need a definitive move in the underlying stock to be profitable.

SHORT VIDEO PRESENTATION: THE FIVE MOVES MARKETS CAN MAKE EACH DAY

ABOUT THE AUTHOR


Author: Matt Hensley
Company: You Can Trade (a TradeStation Group Company)
Website: YouCanTrade.com
Services Offered: Trading Education, Stock and Options Alerts
Markets Covered: Stocks and Options

Chapter 02

Larry Gaines | Power Cycle Trading

Titling the Trading Odds in Your Favor

  • How to defend your position if market is topping out
  • Low-risk strategy that gives an edge in uncertain markets
  • Why Butterflies and Long Condors are my secret weapon

Chapter
02

Tilting Trading Odds in Your Favor

By Larry Gaines, PowerCycleTrading.com

In this short video, I am going to share some different ways to tilt the trading odds in your favor. These are especially effective when trading uncertain markets, like the ones we are seeing now.

The current market has been stretching to the upside and grinding higher with the promise of new stimulus, a new administration, and COVID-19 relief on the horizon. But things may be topping out, and now is the time to start thinking about ways to defend our positions and lower our risk.

I've been trading options for over 30 years, and my favorite two strategies for giving me an edge in the markets are the Option Butterfly and Long Condor. Check out my video on "Tilting Trading Odds in Your Favor" to find out why I consider these to be my trading secret weapon!

SHORT VIDEO PRESENTATION: TILTING TRADING ODDS IN YOUR FAVOR

ABOUT THE AUTHOR


Author: Larry Gaines, Founder
Company: Power Cycle Trading
Website: PowerCycleTrading.com
Services Offered: Trading Courses, Bootcamps/Coaching, Custom Indicators
Markets Covered: Stocks, Options, Futures

Chapter 03

Melissa Armo | The Stock Swoosh

How to Short Panic Stocks

  • Why the market open is the best time to trade
  • How to spot a panic-driven bearish move in a stock
  • What to do when we see a power trend moving short

Chapter
03

How to Short Panic Stocks

By Melissa Armo, TheStockSwoosh.com

Short moves happen quickly and fast due to "panic" in the stock.

Shorting can give you a niche. Many traders don't know how to accurately look for shorts or ascertain bearish moves.

Learn more in this video.

SHORT VIDEO PRESENTATION: HOW TO SHORT PANIC STOCKS

ABOUT THE AUTHOR


Author: Melissa Armo, Founder
Company: The Stock Swoosh
Website: TheStockSwoosh.com
Services Offered: Trading Rooms, Trading Courses, Newsletters
Markets Covered: Stocks, Options

Chapter 04

Ryan Jones | Quantum Charts

Never Again Fear a Stock Market Crash

  • Importance of properly hedging your market position
  • Why there really is no perfect daily hedge technique
  • My favorite strategy for making a killing if stocks crash

Chapter
04

Never Again Fear a Stock Market Crash

By Ryan Jones, QuantumCharts.com

The Importance of Hedging

Hedging your stock portfolio is important for many reasons. The obvious reason is to prevent huge losses should stocks crash or suffer is significant correction. Years of gains can disappear in an instant. 

This is the obvious reason.  What most traders and investors don’t understand are the actual long-term ramifications of crashes on your overall wealth. When stocks crash, it affects your portfolio’s ability to efficiently compound.  This isn’t just about preventing short-term losses.  This is about creating more efficient exponential growth. The long-term result of avoiding a portfolio drop when markets crash is astonishing. 

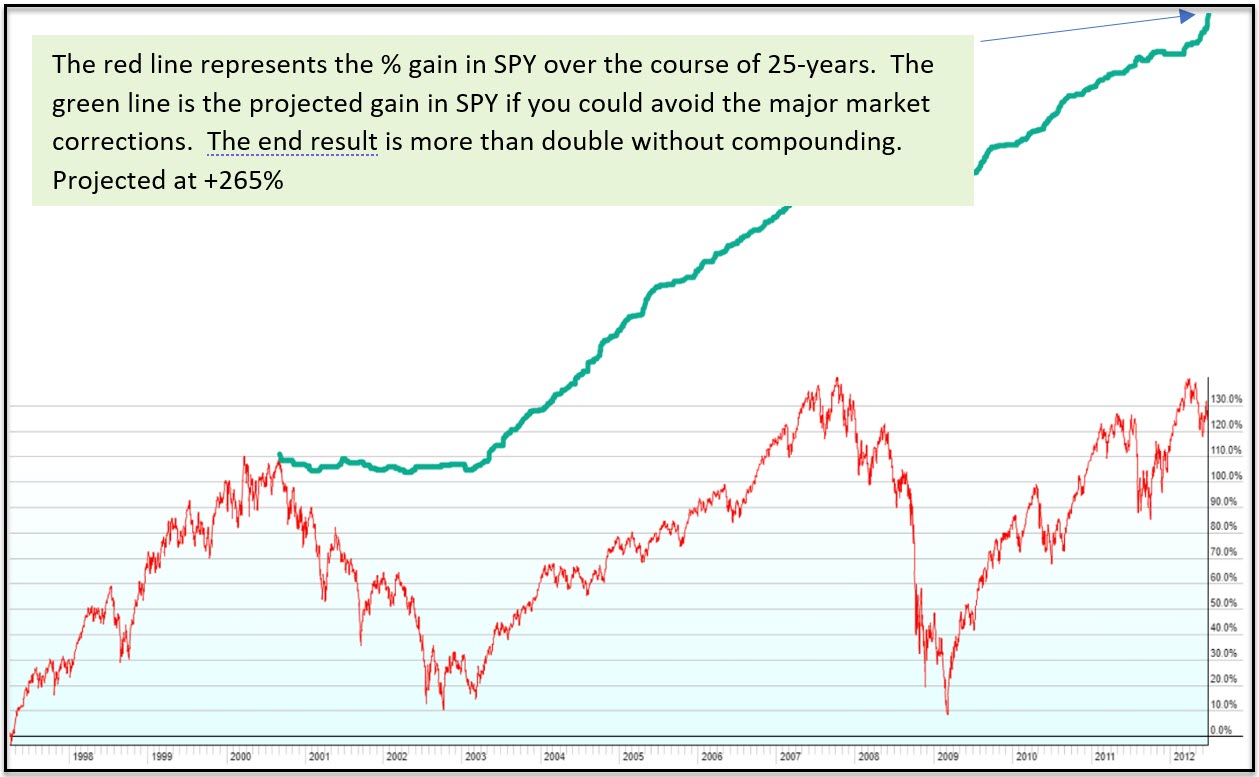
Here is SPY going back about 25-years.  I first posted this graph in January of 2020, BEFORE stocks crashed again!

When you bring compounding into the picture, you really start to feel the true impact major market corrections and crashes have on your portfolio over a 25-year period.

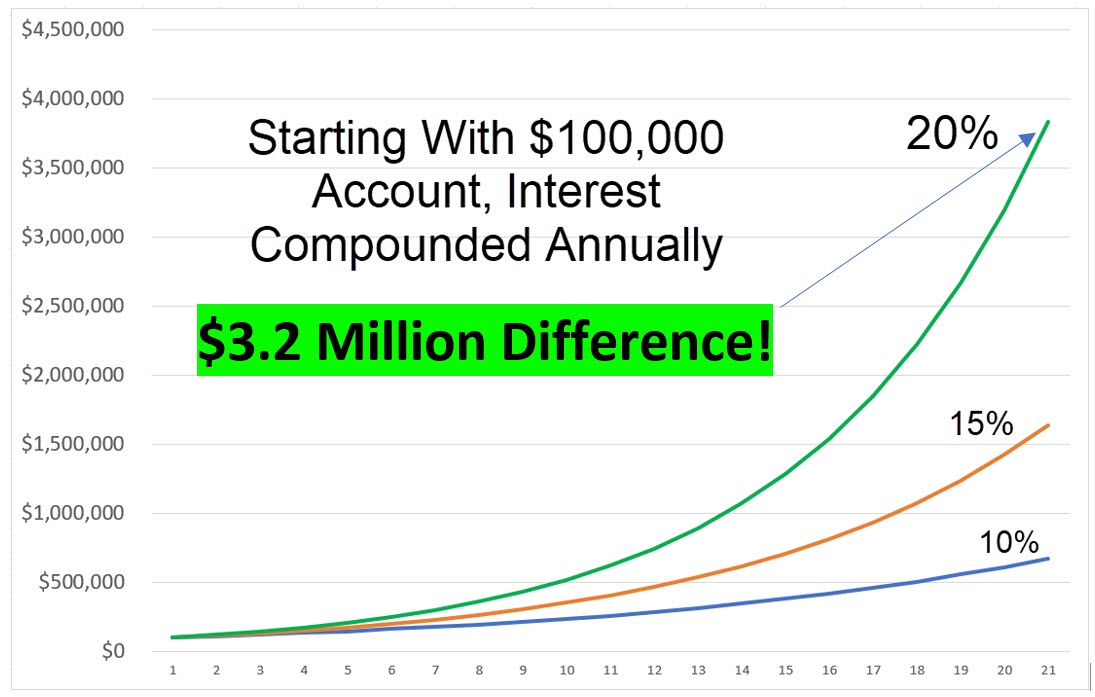
If you can increase your average annual return from 10% annually (with corrections and crashes) to 20% annually, the end result is $3.2 Million over 21-years when starting with $100k invested in the broad market.

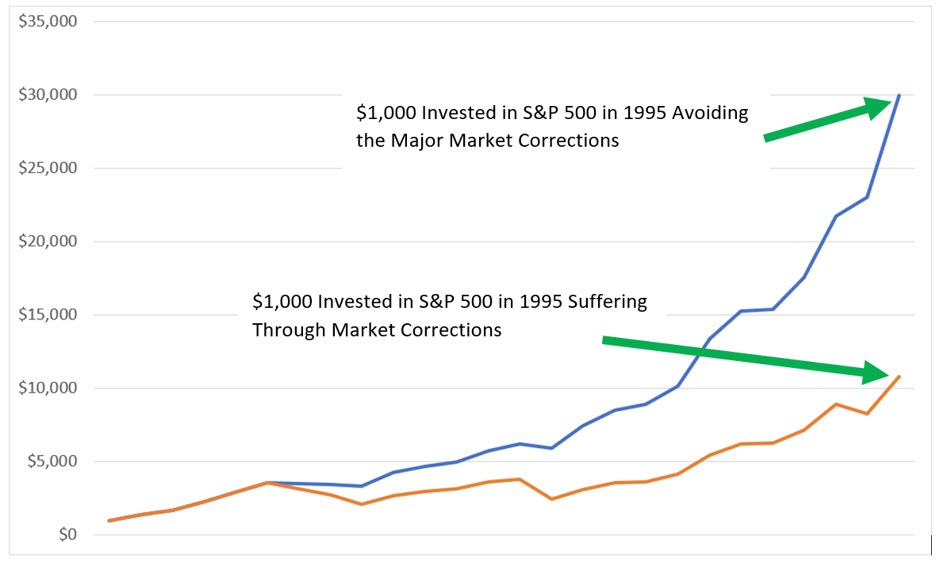
Here is a comparison of $1,000 invested in SPY with and without avoiding the market crashes:


Is hedging important?  More than most investors realize. It is not an option.  If you have a stock portfolio, you need to hedge. 

Common Hedges That Don’t Necessarily Hedge Anything

Do a quick internet search on hedging and you’ll find all sorts of ideas and methods used to hedge against a market crash.  Unfortunately, most of them are ineffective at best, and in some cases, actually INCREASE your risk during a major market correction or crash. 

Here are a few that you’ll find, most are not actually hedges:

  • Allocate a Portion of Your Capital to Cash
  • Buy Gold or Silver
  • Invest in a Bearish ETF
  • Time the Market
  • Cost Average When Market Moves Down
  • Buy Put Options

Do any of these sound familiar.  Let me briefly explain why most of these are not actually hedges against a major market correction or crash.

Allocate a Portion of Your Capital to Cash

This Means Timing the Market Overall and Diminishing Returns.  When should you put a portion of your portfolio in cash?  Now?  Later.  What happens if you are wrong and you miss out on one of the biggest bull markets ever? 

This is not a hedge, it is simply investing less, which means making less.  And, what you have invested will still suffer in a market crash.

Buy Gold or Silver

Buying gold or silver is super popular.  But it isn’t what the hypesters want you to believe so you’ll buy it from them.  It is not truly a hedge against significant market corrections or crashes, and in some cases, may INCREASE your overall risk

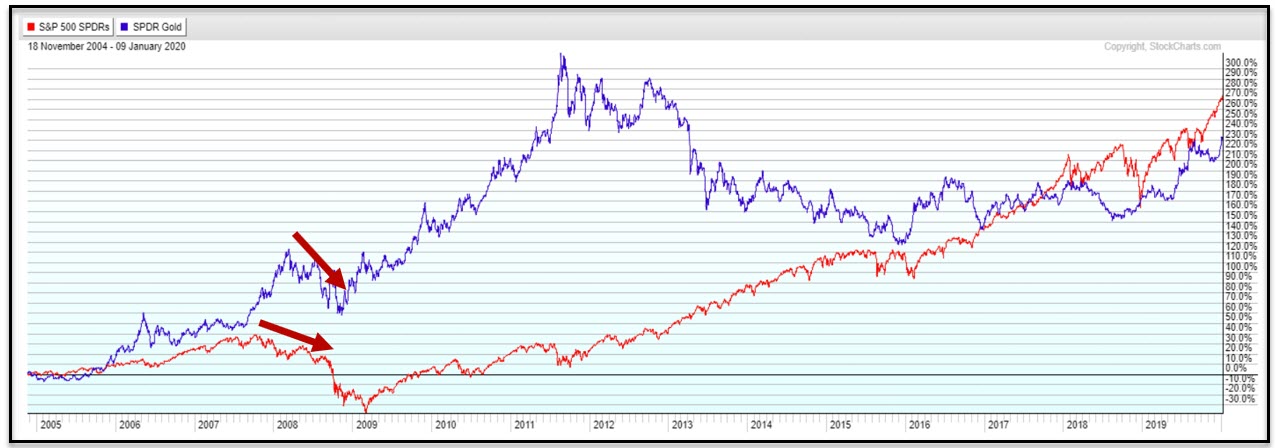
Red line is SPY, purple is a Gold ETF.  Notice in 2007 and 2008 as stocks began to come down, so did the gold ETF.  You would have lost in stocks & gold.  Gold did begin to recover sooner than stocks, but by the time stocks hit the bottom, the recovery in the gold ETF only made it back to where it was when stocks started to move down in the first place.  The net gain from the gold ETF at the bottom of the stock market crash was zero.  You suffered the entirety of the crash.

Moreover, if you are always long gold in order to always be hedged, the time period between 2012 and 2016 saw the gold ETF drop significantly, offsetting much of the gains in SPY during that same time. 

Gold and silver cannot be relied on as true hedges, and can actually increase your risk.

Invest in a Bearish ETF

Bearish ETFs, or “inverse stock ETFs” move higher when stocks move down. 

Sounds like the perfect hedge, doesn’t it?

Actually, I cringe when I hear so-called professionals recommend putting a portion of your portfolio in a bearish ETF as “diversification” or a hedge.  Moreover, I feel sorry for their clients who expect professional, knowledgeable advice.

Just a little thought obliterates the logic behind this so-called “hedge”. 

If I invest a portion of my portfolio in a bearish ETF instead of stocks, it is equivalent of simply moving a portion of my portfolio into cash. 

As stocks move higher, my bearish ETF moves lower, creating LOSSES which are now offsetting my gains in the stocks.

Ridiculous.

If I have 10% in a bearish hedge, and 90% in stocks, I essentially have 80% in stocks and 20% in cash…almost the same exact thing.  The difference is the 10% in the bearish hedge is offsetting 10% of the gains in my stocks…when I only had 90% invested…so only 80% is actually working for me. 

Moreover, the 80% in stocks will still suffer from a major market correction or crash.

There is one positive in this, but it isn’t a big one.  The purple line is SH (bearish S&P 500 ETF).  The red line is SPY.  Because of the 0 line, the bearish ETF from a % standpoint, might drop less than what SPY rises by a few % points over a period of time.  By the end of the graph, SPY was up 18%, the bearish ETF was down only 14%.  Don’t let this fool you thought, when the bearish ETFs get low enough, the do reverse splits and open up the passage way to keep going down. 

Time the Market

This is so silly it is almost not worth mentioning…but I’ve seen some articles out there promoting it as a hedge, so I’ll quickly address it. What if you are wrong? Not a hedge.

Cost Average When Market Moves Down

This is more silly than the previous one.  If I have $100k invested in stocks, and that is all I have, pray tell me how I’m going to cost average when stocks tank 40% and my $100k drops to $60k? 

This is not a hedge.  Your portfolio drops, and you may or may not have more money to invest.  Moreover, what if you cost average and stocks keep dropping? 

Buy Put Options

Finally…we have a true hedge. But, It is a costly one.

Maintaining put options to completely hedge against a major market correction can cost between 5% - 8% per year.  If you only average 10% in your stock portfolio, this becomes a worthless hedging strategy. It can be very disappointing for those who don’t understand how put options work.  Put options in market indexes are expensive.

On the flip side of it, if stocks crash, your portfolio will be fully protected (if you do it right).  In 2020 during the pandemic, when stocks dropped by 35%, my stock portfolio combined with put options dropped only 6% (I was not fully hedged). 

The problem is the cost.

You have to look at puts like buying insurance.  Some of the most consistently profitable companies on the planet are insurance companies.  You know why?  Because they sell you insurance, and insurance is expensive. 

Check out Progressive Insurance performance since 1999 compared to SPY:

(Progressive is in Red, SPY is purple)

It doesn’t always outperform, but long-term, you’ll find this common (hint, one way to increase portfolio returns is to create a portfolio of high-performing, solid stocks that have consistently outperformed the broad market). 

My point being is that selling insurance is lucrative, and buying it is expensive. 

My Favorite Hedge Strategy for Making a Killing

I will be covering these topics and more during my presentation at the Return of the Bear? live financial workshop on March 3rd.  Specifically, I will we sharing my thoughts on:

  • Costly Mistakes of Not Understanding How to Properly Hedge
  • Proper Hedging Strategies Need to be Implemented on a Well Diversified, Solid Portfolio
  • Why there is no Perfect Daily Hedging Technique
  • This Hedging Strategy Will Not Hedge Against Individual Stock Crashes
  • The KEY to Proper Hedging Using Put Options is to PAY for Those Put Options
  • My favorite hedge strategy for making a killing if stocks crash

ABOUT THE AUTHOR


Author: Ryan Jones, Founder
Company: Quantum Charts
Website: QuantumCharts.com
Services Offered: Trading Education, Trading Software
Markets Covered: Futures, Stocks, forex

Chapter 05

Anka Metcalf | Trade Out Loud

Become a Breakout Pro

  • How to spot and evaluate a proper breakout opportunity
  • Three strategies for trading breakout market moves
  • How to use when day trading, swing trading or investing

Chapter
05

Become a Breakout Pro

By Anka Metcalf, TradeOutLoud.com

In this video I will be teaching a simple yet a very powerful strategy that if implemented correctly can work up to 80% of the time on any time frame. The Breakout strategy can be  applied in day trading, swing trading and investing on any asset: stocks, futures, forex or cryptocurrencies. It is also a powerful tool to have in your portfolio if you are an options trader.

Before watching the video there are some steps that you need to follow before you pulls the trigger in this strategy:

  1. Make sure that the asset is in an uptrend: higher time frames as well as lower time frames. Multi time frame synchronicity is very important for a successful follow through.

  2. Bases (ranges) are price pauses at certain points of control, like resistance or resistance projections. 

  3. The pause in price within a defined range suggests that the price is digesting the prior resistance area and accumulating energy  to break higher or to new highs.

  4. Identify which stage the asset is trading in. If the range is forming into a continuation of a state 2 which is the accumulation (greed) stage the move is more likely to continue higher after a range break out.

In the video below, you will learn 3 ways to trade a Breakout:

  •  The Breakout Definition
  •  3 Ways Strategies to Trade Breakouts
  •  Trade Examples

SHORT VIDEO PRESENTATION: BECOME A BREAKOUT PRO

ABOUT THE AUTHOR


Author: Anka Metcalf, Founder
Company: Trade Out Loud
Website: TradeOutLoud.com
Services Offered: Trading Education, Coaching, Futures, Stock and ETF Signals
Markets Covered: Futures, Stocks, ETFs, Day Trading, Swing Trading

Chapter 06

Michael Nauss | Trade-Ideas

Algorithmic Curated Swing Trading

  • Why I use two science-based philosophies for my trading
  • Use backtesting to develop trading plan for current market
  • How trade management is best driver of improved results

Chapter
06

ALGORITHMIC CURATED SWING TRADING

By Michael Nauss, Trade-Ideas.com

Regardless of time frame, my thoughts about trading always remain the same. I have two main philosophies when it comes to trading, both of which are very science based in nature.

  1. Like testing a scientific theory, trading should have a systematic approach that can be testable and repeatable. Each trade does not matter just like each test would not matter. What should be of interest to the trader is a system that is created to be able to make money on the next 10,000 trades instead of worrying about the next one.
  2. The second is that the human memory is awful and we are all very susceptible to confirmation bias. We only remember where a certain pattern works and forget all the other times that it does not.

MY PROCESS

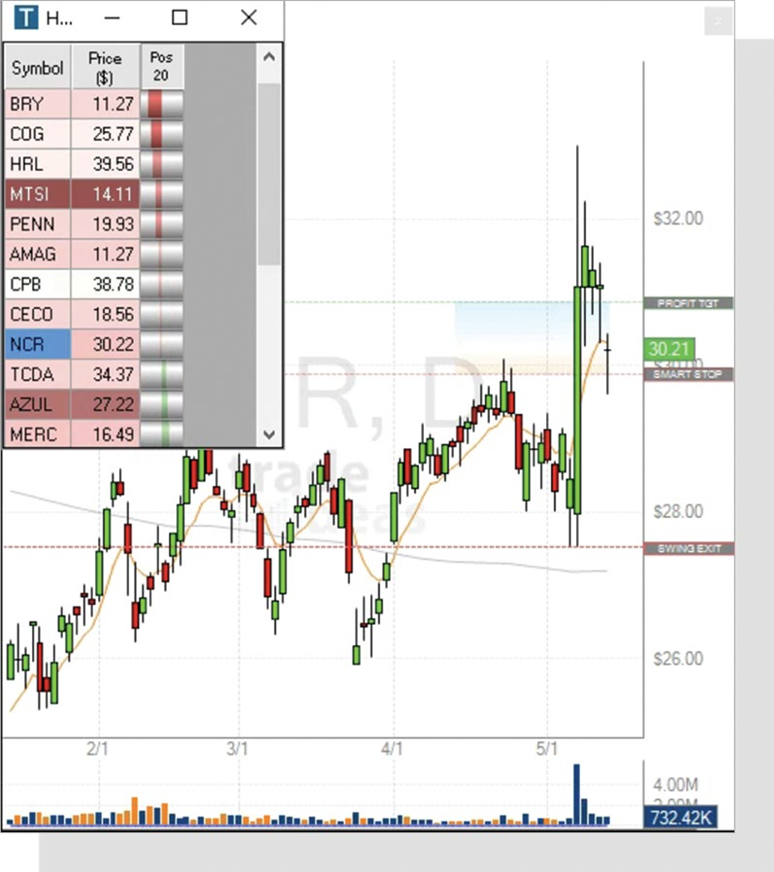
STEP ONE:  Use the trade-ideas backtester to find what’s working in the market currently.

With the trade-ideas backtester you can test what you have seen in the market to make sure your not suffering from confirmation bias. After that you can build a trading plan around it and adjust it as changes in the markets inevitably happen.

STEP TWO: Display all results that would have triggered that day into a top list so you can easily see all of the symbols that are meeting the current criteria.


STEP THREE: Bots and algorithms are great at looking at things en masse but not as good as a human when reading technical analysis. Things like news or how a stock trades with liquidity and past price action are best worked out by a trader.

Scan your list each night picking stocks and entry points few them. I suggest setting price alerts in your Trade Ideas system so you will be alerted when things hit your price.

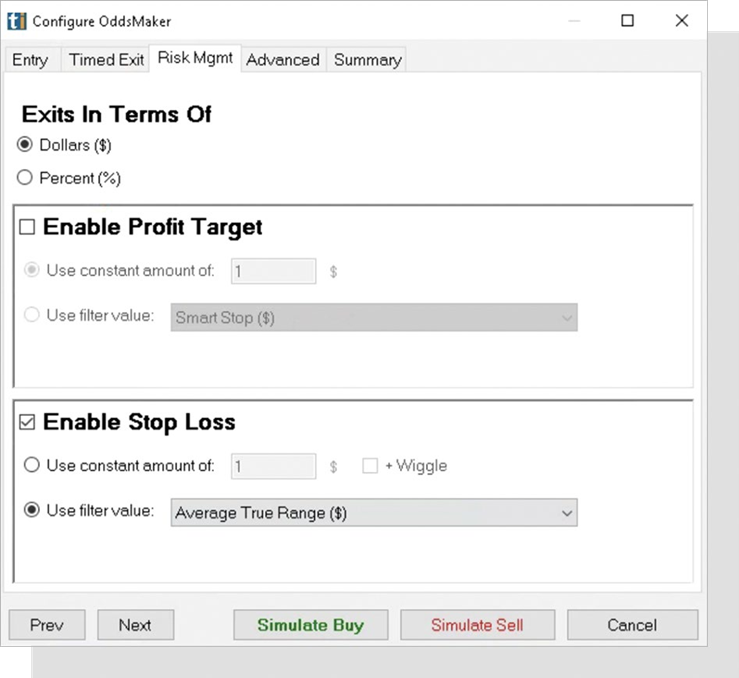
STEP FOUR: Trade your plan! When you originally created and backtested your trading plan you would have entered things like stop loss and hold times into the system.

It seems obvious but it’s important to note that in the long run, your results will be more dependent on how you manage the trade and less on the outcome of your directional bet.

Follow your rules with discipline. Sharpen your trading edge from scanning and watching charts. Keep the statistics on your side.

ABOUT THE AUTHOR


Author: Michael Nauss
Company: Trade Ideas LLC
Website: Trade-Ideas.com
Services Offered: Live Streaming Trading Ideas Powered by Artificial Intelligence
Markets Covered: U.S. and Canadian Equities

Chapter 07

Marina Villatoro | The Trader Chick

Conquering Fear of Missing a Trade Syndrome

  • Why FOMAT and over-trading is your worst enemy
  • Tips and techniques for building a solid trading plan
  • My favorite strategy for trading today’s volatile markets

Chapter
07

Conquering Fear of Missing a Trade Syndrome

By Marina Villatoro, TheTraderChick.com

What is F.O.M.A.T and Why You Need to Avoid it to be a Successful Trader

Have you ever committed to plans, ones that really interest you, and then you get a call for something that, you think, is better and you go into a full frenzy of FOMO. Fear of Missing Out is a real thing and it happens to all of us. However, where it is most noticeable and has a tendency to be the most destructive is for day traders.

The amount of people that chase trades because they believe there isn’t another trade coming is what keeps most brokers always in the green and thriving as they reap in the commissions and the traders deplete their accounts.

Fear of Missing a Trade, or as I like to call it - F.O.M.A.T, is as powerful of an action driven bad decision as greed and putting in the ‘mental’ stops. We all know what happens with greed. The one that we say, “I decided to move my target because the move was so strong in my direction.” Followed, but a huge grievance of, “but then it turned on me and instead hit my stop.”

And the worst part of that, was that it could’ve been totally avoided if only you stuck to the initial target and instead of crying all the way home, you’d have cashed in on a great trade and greed would not have won the day.

And starting the discussion on ‘mental’ stops, requires a whole other article because we all know how reliable they are. Let’s just say if there is no real stop loss in place, you might as well say goodbye to all your money, because EGO has a great way of not allowing you to admit you are wrong to call a bad trade just that and get out before you lose the farm. 

F.O.M.A.T doesn’t fall too far from the tree that these bad apples grow on. Why? Because beginner traders fear there will never be another trade like the one that they just missed.

Here’s a news flash! There is always ALWAYS another trade coming. It might not be right that very second, but it’s coming and it’s probably better than the one you missed. Because that one has already left that station.

Would you jump on the rails of a subway that just passed by and started running like a maniac after it. NO! The very idea of it is ridiculous. Because we all know that there is another subway, metro, train coming. 

Sometimes all it takes is trust and patience. But don’t take my word for it. 

Backtest!

Every time you chase a trade because you are fearing that you won’t get one that day, see how often it works out. I can guarantee after 20 times you will see that maybe 10% worked out. And you never want to be in a trade that is only working out 10%, that means 90% of the time you’re literally donating your money to the market.

Remember this - there is always another trade coming!!!

SHORT VIDEO PRESENTATION: CONQUERING FEAR OF MISSING A TRADE SYNDROME


ABOUT THE AUTHOR


Author: Marina Villatoro, Founder
Company: The Trader Chick
Website: TheTraderChick.com
Services Offered: Trading Education, Boot Camps, Trading Community
Markets Covered: Futures, Equity Indices and Commodities

Chapter 08

Peter Schultz | Cashflow Heaven

Selling Credit Spreads in Volatile Markets

  • Why selling credit spreads is a smart high-odds strategy
  • 3 strategy rules for consistently leveraging time decay
  • When to close your position to protect your profits

Chapter
08

Selling Credit Spreads in Volatile Markets

By Peter Schultz, CashflowHeavenPublishing.com

See how to collect big profits from a low-volatility strategy—even in crazy volatile markets

Selling credit spreads is a smart high-odds strategy because you have the biggest, most consistent characteristic of options working for you—time decay. That’s why most professional options traders and anyone who has been around for awhile uses this strategy for the majority of their options trades—because the odds tell us this strategy will work in your favor the majority of the time.

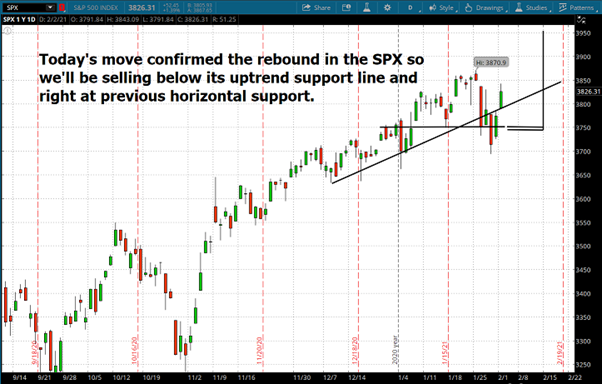
This chart is typical of our recommendations and shows why you have such an overwhelming chance of winning.

As it turned out the SPX we got paid a very nice credit, and then the SPX continued much higher reducing that credit and creating an increasing margin of safety in the trade.

And thats what typically happens even after a volatile move like you see above. Take a look at that chart and where the spread was placed. If the SPX closes anywhere above our spread, it expires at a full profit. Keep in mind the SPX is heading higher—and has broken above uptrend support—plus we’re selling at or below much lower horizontal support. So, the first rule of this strategy stays consistent in any kind of market:

Strategy Rule #1: Sell your spreads away from where the stock is heading—in other words where the stock is unlikely to go.

That’s the main reason you have such a great chance of winning--because the index would have to do something really crazy for you to lose. All other things considered, you’ll win on this trade—and the options statistics consistently confirm that.

Remember when buying straight puts and calls you need to be almost perfect on both direction and timing to make money. If the direction is right but the stock takes a little longer than you thought to move your way, then the option can expire for a big loss.

But it’s just the opposite when you are selling options. When selling a put spread, like in the example above, if the SPX spikes higher you win—if it goes up just a little bit you win—if it goes sideways you win, and even if it goes down a little bit—you still win.

That’s why we sell out of the money credit spreads--and it’s why you should as well.

But What Happens if the Market Goes Crazy—Isn’t this the LAST Strategy You Would Want in a Volatile Market?

That’s the common wisdom—most traders will tell say you would have to be crazy to sell credit spreads in a volatile market. But in this short presentation you are going to see some surprisingly compelling reasons to do exactly that.

Why? Don’t volatile markets induce huge risk in selling spreads?

Yes, they do—but if you know how options are priced you can take advantage of that volatility premium to make even bigger profits with less risk.

Here’s why—when you sell an out-of-the-money credit spread you are selling options that are entirely time value—there is no intrinsic value because the option out-of-the-money.

So the key is how the market assigns value to the time portion of the option.

That value has a lot to do with expectations. And expectations have a lot to do with what happened with the underlying in the recent past.

For example, if a stock or index just made a big move—or just reported earnings—or just whipsawed in both directions—exactly the kind of thing that happens in volatile markets—the implied volatility goes through the roof.

But here is what is interesting—crazy wild swings don’t last--they are typically followed by periods of calm.  

And that creates opportunity because the time value of an option can become very expensive because the stock just jumped this way or that—and often that value stays with the option even as the stock starts to settle down.

Which is why one of the best times to sell an options spread is the day AFTER a stock announces earnings—because the options premium is often still elevated—and yet the stock is already settling down.

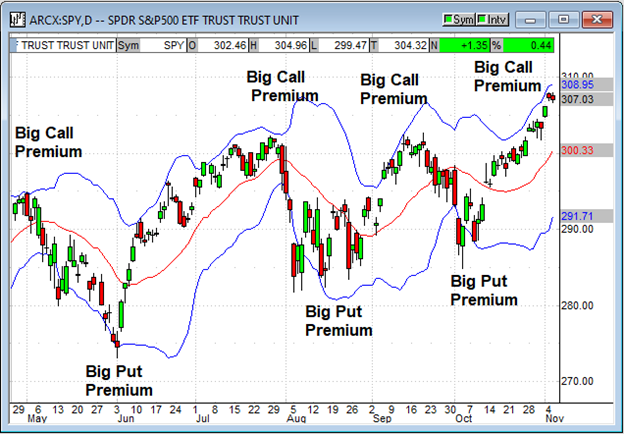
One of the easiest ways to see this behavior is with Bollinger Bands.

When the stock trades in a fairly narrow range for a while the bands narrow—but when there is an explosion one way or the other the bands get very wide. When those bands are wide is when the time value of the options are at an extreme high—and it’s often the perfect time to sell.

The reason is—as you can see from the chart—explosive moves don’t last. They are almost always followed by periods of calm, and when the stock starts to settle down into a sideways move all that volatility premium rapidly dissipates.

Strategy Rule #2: Sell AFTER an explosive move to capture volatility premium.

In addition to our first rule of selling options where we think the stock isn’t going to go, we’ve now got a second rule which is especially true for selling options in volatile markets. And that is to sell AFTER an explosive move.

The premiums are much higher than normal, and they will dissipate quickly the moment the stock starts to settle down.

Wouldn’t it be nice to see at a glance whether options premiums are expensive or cheap?

Yes—that would make this strategy much easier, and fortunately, there is a way.

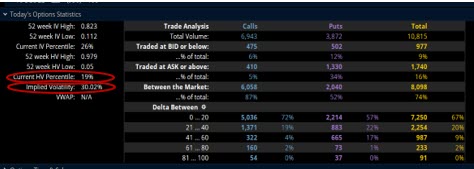
Many options trading programs and brokers now show statistics for historic versus implied volatility. Historic volatility is what the range of movement has been over a long period of time. Implied volatility is what the volatility is right now.

The key when selling options to take advantage of inflated pricing is to sell when the implied volatility is HIGHER than the historical volatility. That tells us at a glance that the time value of the options is high—and that it has a good chance of settling lower in the immediate future.

So where do we find that information? We generally recommend the thinkorswim platform for options because they have really great trading tools, have the ability to get you filled inside the spread, and are competitive on their fees.

Any good options trading platform should be able to provide this information but on the thinkorswim platform you go to the trade tab and enter whatever underlying you are interested in—either a stock or an index--and at that point all the different expiration dates will populate under your ticker.

Scroll to the bottom of all those different dates and you’ll see a drop-down arrow that says, ‘Today’s Options Statistics’. Click that drop-down arrow and you’ll see all kinds of options numbers but what you are looking for is the current Historic Volatility (HV) percentage versus the Implied Volatility.

If the implied volatility is higher than the historic volatility—like what you see above--then you know the time portion of the option is particularly expensive and is probably worth selling.

And the opposite is true as well—if the implied volatility is lower than the historic volatility then the time portion of the option is cheap and probably not worth selling.

Here’s what is interesting about the time value of an option—everyone thinks the value is based on the time remaining until expiration—but it’s really based on the implied volatility of the underlying.

Let me give you an example; let’s say you sell an option with 10 days of time left on it and the time value is 3 dollars—which means there is 30 cents worth of value for that option per day. And your goal when you sell is to let enough time decay to go by to realize 70% of that value and then you’ll close the position. So naturally you figure you’ll have to hang on for 7 days to capture 70% of the 10 days of time value.

But what actually happens was after you sold the option the stock stabilizes and the volatility premium on that underlying collapses so that all of a sudden you’ve realized 70% of that 3 dollar premium in just 4 days. It’s kind of like time got compressed. You thought going in you’d have to hold on to the position for 7 days, but you really just have to hold on for 4.

That’s a huge win because it allows you to make another important move toward stacking the deck in your favor when selling options in volatile markets---

Strategy Rule #3: Make your target profit and get out as soon as possible to limit your risk.

Benefiting from both time decay and volatility collapse lets you realize your target gains quickly so you can close the trade, capture your profits, and eliminate your risk.

You see the more time you spend holding a position in a volatile market the more chance there is of something bad happening. So, selling high volatility and closing at low volatility allows you to realize your profit goal much more quickly. And that’s especially true if you have no idea where the stock or index you are selling against is liable to jump next.

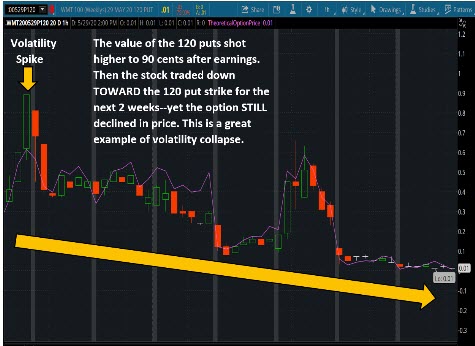
Here is a great example of volatility collapse:

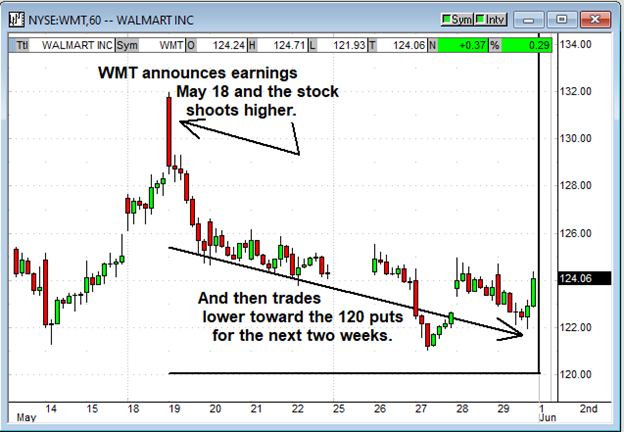
Walmart shot higher and reversed sharply after their earnings announcement May 18 and that volatility spike rocketed the May 29 expiration 120 put value straight up.

And then right after that the stock started falling--trading consistently toward the 120 strike. So what happened to the value of those puts? Since the stock is heading toward them, you’d think their value would go up.

One of the standard characteristics of options is that the value of calls goes up when the stock goes up--and the value of puts goes up when the stock goes down.

But look at the chart above showing the value of the WMT May 29 puts in the seven days before expiration. The stock steadily traded TOWARD the put strike as you can see from the Walmart (WMT) chart, and yet the puts kept dropping in value until they hit zero at expiration.

Part of that drop in value is time decay—and that was really evident in the last two days—but what is wild for options traders is to see the stock heading toward the strike and STILL have the value drop so dramatically.

That’s the exact opposite of what you’d expect and is almost entirely due to volatility collapse.

The conclusion is that selling credit spreads—or selling options premium in general—in times of inflated volatility is actually the PERFECT time to sell because the time value dissipates so quickly once the stock starts to settle down.

So, in conclusion there are 3 basic rules for selling options in volatile markets that can REALLY stack the deck in your favor:

Strategy Rule #1: Sell your spreads where the stock isn’t likely to go.
This is the most basic fundamental rule of spread selling and it’s what makes this strategy so high-odds to begin with—all other things being equal—you win. The key is selling in the opposite direction of the trend and selling put spreads below support and call spreads above resistance.

Strategy Rule #2: Sell inflated volatility options to capture inflated premium that is likely to dissipate quickly, making you money with volatility collapse—in some cases even if the underlying goes toward your sold strike.

As we’ve seen this is a HUGE key to success—because you bring in more premium in the first place, and it tends to dissipate quickly—which allows you take advantage of rule number 3.

Strategy Rule #3: Make your money quickly and close the position once you’ve realized the majority of your gains.

Now you’ve got two powerful tools to help you do that--time decay AND volatility collapse.

This is one of biggest keys to trading in volatile markets—once you’ve made the majority of the potential profit on a trade—say 70% to 90%---close the position. And that’s especially true if you’ve got several days left until expiration.

The moment you do that you’ve removed all your remaining risk--which is especially important when trading unpredictable markets. Remember one big gap up or down could turn a winning trade into a loser.

Follow these 3 simple rules and you might be surprised how enjoyable—and profitable--volatile markets can be.

Selling spreads gives you so many advantages—especially if you know a few little tweaks to really work the characteristics in your favor. To get a free eBook and trading letter on why this strategy works so well—and how to start implementing these trades in your own account so you can start realizing some surprisingly consistent gains, go here now.

ABOUT THE AUTHOR


Author: Peter Schultz, Founder
Company: Cashflow Heaven Publishing
Website: CashflowHeavenPublishing.com
Services Offered: Trading Courses, Coaching, Weekly Advisory Newsletter
Markets Covered: Stocks, Options

Chapter 09

Geof Smith | Diversified Trading Institute

New Administration = New Opportunities

  • Overview and assessment of current market conditions
  • Which factors are having biggest impact on the markets
  • My strategy for leveraging new emerging opportunities

Chapter
09

New Administration = New Opportunities

By Geoffrey A. Smith, DTItrader.com

In this brief video presentation, I will share with you information about the current state of the markets, my strategy for exploiting upcoming market opportunities along with a few examples of how my strategy works.

Stock Indices are making new all-time highs. As the government continues to print money, the US dollar is weakining. Commodities are moving higher, and "sector rotation" is setting in as dollars flow into select small and mid-cap stocks.

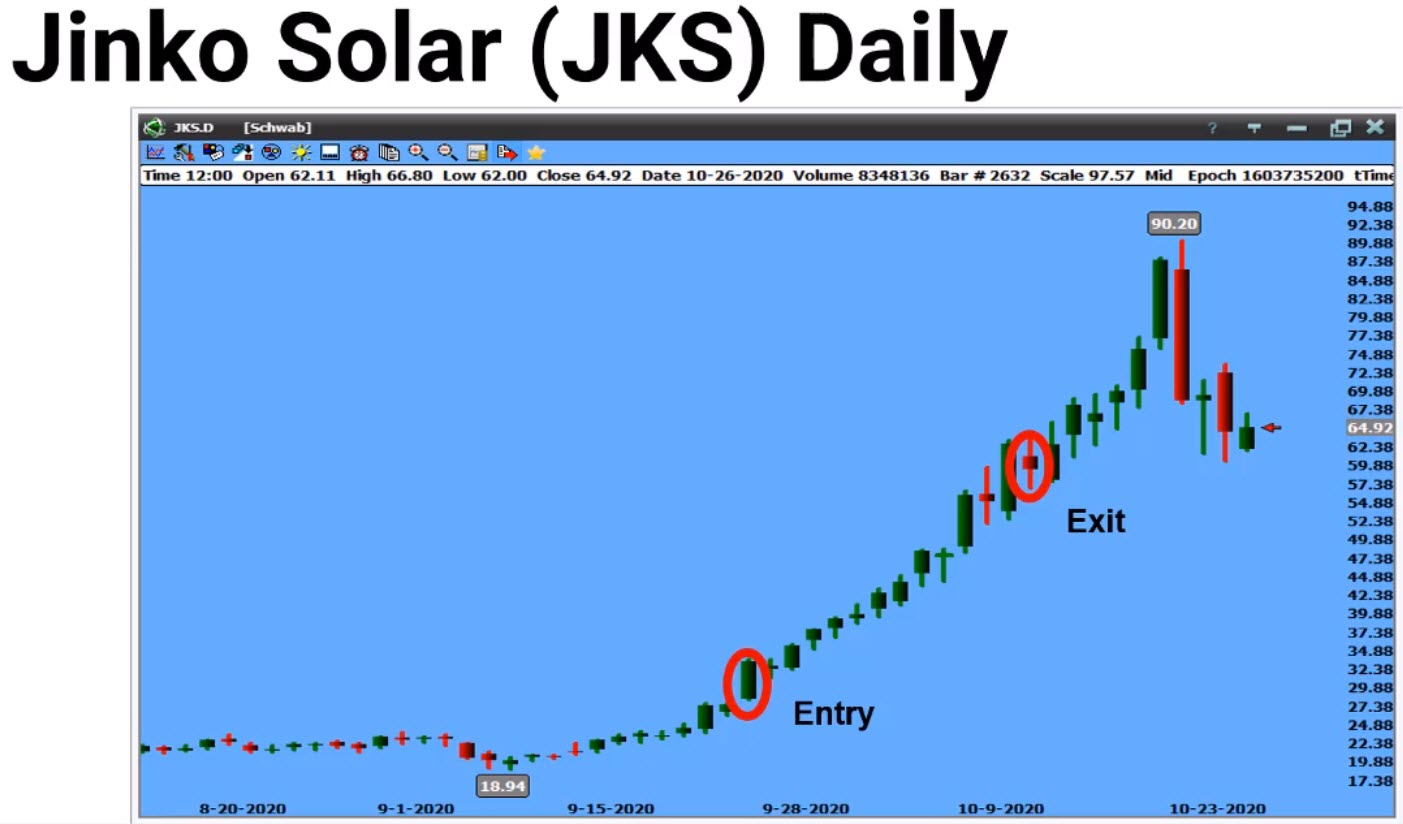
Solar stocks are one area to look at with the new administration, as Biden plans to champion the environment with bold green energy initiatives. I bought the $29 call for Jinko Solar (JKS). It shot up to $90 so I did okay on that particular stock option play.

During my presentation, I will be sharing my methodology, along with several other stocks that could have strong potential over the next year.

SHORT VIDEO PRESENTATION: NEW ADMINISTRATION = NEW OPPORTUNITIES

ABOUT THE AUTHOR


Author: Geoffrey Smith, CEO & Chief Instructor
Company: Diversified Trading institute
Website: DTItrader.com
Services Offered: Trading Education, Trade Alerts, Trade Rooms, Software
Markets Covered: Stocks, Options, Futures, Day Trading, Swing Trading

Chapter 10

Adam Sarhan | WealthPress

Technical & Fundamental Analysis Redefined

  • New truths about technical and fundamental analysis
  • The best time to use these tools to our advantage
  • How history helps us understand what is working now

Chapter
10

Technical & Fundamental Analysis Redefined

By Adam Sarhan, Wealthpress.com

Most people lose money on Wall Street. Why? Because they are human and they make emotional, not rational, decisions with their money. We believe fundamental and technical analysis are very powerful tools in an investor’s toolbox. The key is to know how to use them.

We have gone back and studied every leading stock (strongest % change) for the past century and here are some of our findings. Some of our findings will surprise you, but we are here to share with you our techniques and shed some light on what actually works on Wall Street.

First, the truth about how to use fundamentals:

  • The strongest stocks in the market do not always sport the strongest sales and earnings growth (this may surprise growth investors).
  • In fact, many leading stocks enjoy HUGE triple digit gains and they have decelerating, or negative earnings growth, or no sales to speak of! Some recent examples include: All the no sales Biotechs that have had HUGE RUNS. Others include, CARA, PBYI, or BLUE, just to name a few.
  • Earnings data looks backwards. The market looks forward and pays up for future growth.
  • When evaluating leading stocks, look for stocks that are favored by institutions and have a unique story. Just like Hollywood, stocks with the sexiest stories, or a unique value proposition (AAPL, NFLX, AMZN, FB, GOOGL, PCLN) tend to become big leading stocks.
  • Some of the strongest stocks in the market are what we call undervalued growth stocks. Meaning they attract both value and growth investors. Apple has been a great example of an undervalued growth stock in recent years.

The truth about how to use technicals:

  • Don’t buy breakouts. Technical analysis 101 tells you to buy breakouts. Our studies show that most breakouts fail and we do our best not to buy breakouts.
  • Instead, use our advanced/early entry points. We Buy Leading Stocks - EARLY. The way we buy leading stocks early is by buying the strongest stocks as they are building a new base. Every stock in history rallies, bases, then rallies again. It’s just a fact. Bases come in all different sizes and shapes (any basic book on technical analysis will give you examples). So once you have identified a leading stock
  • BE PATIENT. Then wait for it to build a new base instead of buying a breakout, or blindly chasing it during an uptrend. Then, once you identify a new base is being built, try to buy as close to support as possible or buy the bounce after the dip. Meaning, buy as the stock breaks above a downward trendline in the respective base.
  • How to buy a dip! We have a little twist on the old “buy the dip” mentality. Instead of buying a dip (because we don’t know how low a dip will be), we exercise patience and buy the bounce after a dip. This way we are buying on the way up, not down.
     
  • Know your customer rule. If you manage money for a living, one rule is to know your customer, so you can recommend investments that are suitable for their objectives and risk tolerance. When it comes to buying leading stocks, it’s important to know how your leader behaves (price action). This way, you can buy it as it pulls back and not just chase it after it rallies. Big leaders (AAPL, TSLA, NFLX, CELG, GOOGL, PCLN) tend to enjoy huge rallies. Then PAUSE/pullback to digest those gains. The pullback and new base could take months and even years in some cases. Again, patience is critical because you can identify when a big leader is basing.

    Like AAPL 2012-2013, TSLA 2014-early 2016, GOOGL 2014-2016, NFLX 2011-2012, just to name a few. You can buy them as they are moving back up the right side of the base, or as they break above important moving averages or downward trendlines --- in the base --- BEFORE they breakout to new highs.
     
  • Powerful BREAK-AWAY GAPS. One of the strongest signals of a BIG MOVE HIGHER comes from a big breakaway gap, especially after earnings. This occurs when a stock GAPS above resistance of a big base and typically begins a new/huge leg higher. Again, risk management is key but typically you can buy the big gap with a close exit to protect from the downside.


ABOUT THE AUTHOR

Author: Adam Sarhan
Company: Wealth Press
Website: WealthPress.com
Services Offered: Trading Courses, Mentorship,
Markets Covered: Stocks, Options, Futures, Forex

Chapter 11

Stephen Bigalow | Candlestick Forum

Identifying Bullish and Bearish Market Sectors

  • The two major activities that are driving sector potential
  • How Candlestick patterns reveal investor sentiment
  • Using the RARE process to find the best opportunities

Chapter
11

Identifying Bullish and Bearish Market Sectors

By Stephen Bigalow, CandlestickForum.com

A Candlestick Forum RARE ( Research Analysis Reverse Engineering )  report

The intention of this e-book is to demonstrate the Candlestick Forum’s RARE process for identifying which sectors will act the most bullish or the most bearish based upon market influences.

The RARE process is exceedingly simple! Candlestick signal and pattern breakouts reveal dramatic changes of investor sentiment. Reverse engineering is merely investigating what caused the reaction, news, political changes, etc. Then evaluating whatever created the change of investor sentiment will be likely to continue the price move.

Currently, there are two major aspects for utilizing the RARE process.

Politics! Candlestick scanning techniques will provide immediate insights into which sectors will react the most bullish or the most bearish based upon the new administration’s policies. The oil sector has been demonstrating signs of weakness based upon Biden’s policy changes. The green energy sector is obviously gaining strength. Knowing which sectors are going to be influenced the greatest allows for high probability profitable short-term trades.

The results of the RARE process can also be utilized for profiting in sectors that indicate a much longer expansion of market share.

The electric vehicle industry!

There have been huge gains in the electric vehicle stocks over the past two years. This report is not written to recommend which electric vehicle related companies should become your next investment. Whatever might be suggested in this report could be obsolete by the time this report is read. (The term electric vehicle will refer to all alternative energy vehicles)

There will likely be huge gains in this sector over the next few years. Some stock prices are overbought, others have not yet reached their potential. How do you identify which positions to be buying? That is where the Candlestick Forum RARE program can provide tremendous profitable opportunities.

Although candlestick analysis provides excellent identification of short-term price movements, it also has a very powerful application for longer term investing. Candlestick signals and patterns reveal when there is a buildup or major change of investor sentiment.

This produces an excellent trading methodology when identifying a sector that has been producing strong profitability.

When Stock prices are producing bullish candlestick signals and patterns in a vast majority of companies in a sector, that induces reverse engineering, stimulating the investigation of what is occurring in that sector. This has been clearly revealed over the past two years in the electric vehicle sector. Candlestick charts started showing strong buying in numerous stocks that were related to the alternative energy vehicles.

How does candlestick analysis provide an advantage for profiting from trading in this sector? Simple, the graphics of candlestick charts reveal immediately when there is a change of investor sentiment in any particular stock chart. This becomes very important when trying to invest in the best companies in a sector that is getting constant publicity.

This e-book is not going to go into excessive detail as far as particular areas related to alternative energy vehicles. The point of utilizing candlestick charts to identify which areas/companies are gaining new investor favor.

Why are electric vehicles becoming more acceptable?

Two years ago, investing in the electric vehicle sector was considered a fringe/high risk investment area. The concept of electric vehicles was not an accepted prospect. It would take a lot of changing of public sentiment. To consider a new energy product that would replace the gasoline engine was a futuristic concept.

Tesla automobiles were deemed as merely a product that might capture a teeny portion of the vehicle market. They were considered merely a status vehicle or a ‘statement’ vehicle for the clean energy advocates. However, TSLA stock price has acted as a double promo. The huge gains in Tesla stock constantly produced attention to the electric car vehicle sector.

Elon Musk, making well-publicized projections, made headlines. This brought more attention to the viability of electric vehicles. The general public became more aware of the potential of electric vehicles entering the automobile market based upon his statements that always gained public attention. The constant escalating of the Tesla stock price added more public awareness.
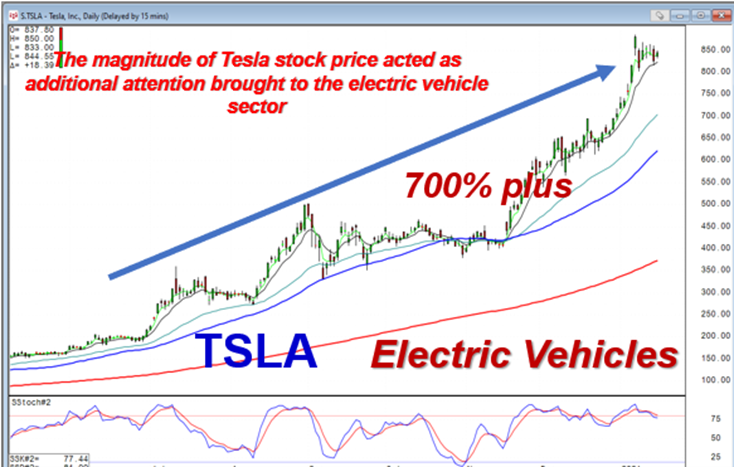
TSLA stock price was a gauge that would monitor the validity of whether Elon Musk’s statements were confirmed or not. This produced more publicity for the electric vehicle concept.

Chinese automobile manufacturers, such as NIO, with huge price movement over the past year, also kept the spotlight to the advances that were being created in electric vehicles. NIO stock price, moving up over 1000% during the past 18 months, indicated the electric vehicle industry was not merely a U.S. passing phase. Clean energy vehicles were a worldwide interest

The electric vehicle industry now has a much more viable prospect of gaining huge automobile market share going into the future. There are two major factors that indicates this industry has the momentum of becoming a very large participant in the automobile industry.

TSLA, as the considered leader of the EV sector, produced just shy of 500,000 vehicles in 2020. Obviously, that takes their production out of the whimsical product category and makes it more evident that EVs is a viable market contender.

Electric vehicles becoming accepted

There is the realization, of the general public worldwide, that electric vehicles are becoming a very viable element in future transportation. Again, this is a product of Tesla stock price producing great publicity that electric cars are gaining in market share.

Electric vehicles are also looked favorably upon because of the lack of polluting byproducts. Gasoline engines bad! Electric motors good! Electric motors do not produce exhaust emissions.

Electric motors are quiet. This is generally considered a good thing but it does have negative ramifications. People like to hear a car coming. But in general, the conception of an electric motor versus a heavy, pollution producing gas engine, is much more favorable.

As electric vehicles slowly gain more market share, the acceptance of electric vehicles becomes easier for overcoming the doubts that they would be effective running transportation.

Technology advances

Although the alternative energy vehicles are likely to be capturing much larger shares of the auto market, there are still major negatives regarding stock prices. The technology improvements, that have moved alternative energy vehicles into the spotlight, are also a negative aspect for investors.

Technology has both good and bad elements!

The advances in technology have brought this sector into the forefront of investment opportunity. But it also makes for investment risk.

There are two major dynamics when evaluating which companies are going to be taking over large portions of the automobile industry. The different energy concepts have to be evaluated. The fuel-cell companies, producing hydrogen motors, is one area making technology advances. The battery powered electric vehicles are another area.

The fuel-cell companies, such as PLUG, FCEL, BE, producing hydrogen powered engines, might not be able to compete as well in the family vehicle area of the market, but may be more restricted toward heavier/long-haul vehicles. This creates evaluation of which companies, utilizing hydrogen power can advance their technology, to be able to capture the areas of the market in which they are likely to be able to produce vehicles.

The lithium battery powered vehicles would likely be more restricted to the lighter passenger vehicles. This also produces a dual dynamic of each company’s technology improvements and specific products produced. For example, TSLA, NIO, LI, would all be producing automobiles that would be competing with each other. The technology advances in this area will obviously help a specific gain market share.

Technology advancement ramifications

The improvements in technology cannot be assessed as improving the overall electric vehicle sector. There can be some very extensive ramifications when new improvements are made by specific companies. It not only affects competitors in their direct market, but it could drastically affect other areas of the current electric vehicle industry.

Technology is what has brought electric vehicles as a viable product. Two years ago, Elon Musk’s touting of electric vehicles seemed more like a fringe product possibility. The concept of electric vehicles was still very alien to most investors and the general public. However, as the technology has improved over the past two years, the probability of electric vehicles being a viable product has become more accepted.

The initial range estimate for a Tesla automobile was approximately 120 miles per charge. This limited the marketability of a Tesla automobile. Hopefully, you didn’t work more than 60 miles from your home or gliding back into the driveway may have been doubtful.

But technology has now improved to where the Tesla model S has a 420-mile range. This obviously takes away the anxiety of whether you might be stuck out on the road somewhere with low batteries.

NIO recently announced that their batteries should be able to produce 625-mile range. Tesla has also recently reported their new battery technology will produce the same range.

Technology improvements can adversely affect other areas

How does advancing technology influence other areas of the electric vehicle area? Improved battery charge ranges could have a direct effect on companies like BLNK, setting up electric automobile charging stations. How would larger mileage ranges from battery technology affect charging stations?

It can be assumed that if a vast majority of automobile drivers do not drive more than 600 miles on any given day. Their automobile will be recharged once they have pulled back into the garage.The relevance of electric vehicle charging stations becomes much more insignificant. Maybe the function and profitability of charging stations now becomes relegated to emergency charging.
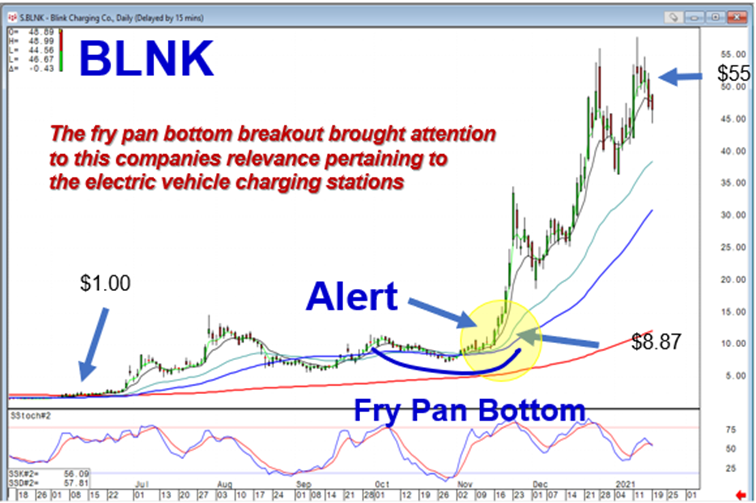
As technology advances, the perception of future prospects for companies, related to the electric vehicle industry, can change. BLNK charging stations may not be as vital if lithium battery charges can produce much larger mileage ranges.

Technology affecting prices

An electric motor has very few moving parts, a major maintenance consideration. The motor is much lighter than a gasoline engine. Electric motor also produces extremely strong acceleration, much better than a gasoline engine.

The average life of a gasoline engine is approximately 150,000 to 200,000 miles. The estimated life for electric motors is closer to a million miles.

What is the nature of technology? The expensive introduction of a new product/concept usually is very expensive at the front end. Remember the first flatscreen TVs. A 40-inch flatscreen was $4500. Today you can buy a 40-inch flatscreen TV at Walmart for $299.

Pocket calculators could be bought for $225 when they first came to the market. Now you can buy a pocket calculator at the Dollar store. The natural evolution of technology is as more people improve the technology, the incentive is to make that technology less expensive and more competitive.
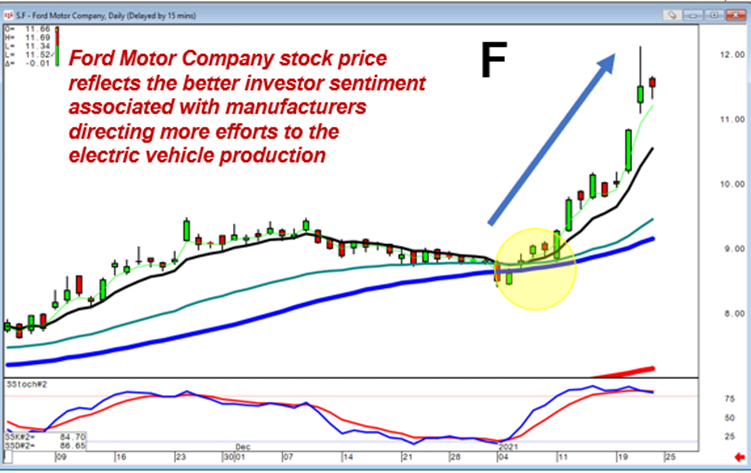
Ford Motor Company stock, moving up strongly after they report they are applying more resources into the electric vehicle area, clearly reveals the potential major changes in the automobile industry.

The major auto manufacturers, Ford and GM, moving heavier into the electric vehicle area can have dramatic ramifications. Their existing manufacturing and research capabilities could rapidly overshadow smaller electric vehicle produces. Or the speed of which they may want to partake to get into the electric vehicle market may make smaller manufacturers take-over candidates.

Candlestick charts provide a visual indicator for identifying possible big profit situations getting ready to occur.

As technology improves, there will be dramatic changes in automobile production. Could the ever-increasing prices of automobiles start turning around and heading lower? It is happened before. When Henry Ford produced an automobile for $375 when other automobiles were selling much higher, there was a significant change in the industry.

Do you know what each improvement in technology will do to help or hurt other sectors? That is a hard analytical evaluation. However, as an individual investor, you do not have to do extensive research and prognosis analysis to identify what one improvement in technology will do to help some sectors and hurt other sectors. That is what candlestick charts will reveal immediately.

How to make money from the electric vehicle sector?

The electric vehicle industry is becoming more accepted by consumers. It is also being well accepted by the investment community. Huge sums of investment funds have gone into the industry. The SPAC boom has produced low-cost capital for funding new companies coming into the industry. These funds are being used for product development, manufacturing expansion, distribution systems, as well as other aspects for developing alternative fuel transportation.

Not only has the funding of new startup endeavors been easier through the SPAC, but there has not been any lack of interest from investors to participate in the startup funding area. This is also another indication that the future for electronic vehicles is being well accepted.

The big question is, “which companies have the greatest upside prospects?”

That is where the Candlestick Forum RARE program creates a huge advantage for investors. Which stock prices are in overbought/high risk areas? Which company’s stock price might be negatively influenced by new technology coming into their area of the market?

Candlestick analysis indicators provide a very clear trading methodology for analyzing the price trends of stocks that are already well-established as far as their stock trend movement. But there is a much more powerful use for candlestick charting! Candlestick signals easily identify when a new technology development is being introduced to the markets. Candlestick signals will produce immediate validation of investor sentiment, when reacting favorably to a company”s news announcement.

You probably do not have a huge research capability, able to follow the technology being developed by a large number of companies, there are at least 50 well-established companies, with another 100 plus startup companies, working on viable technology. To try to monitor what each company is doing is a huge undertaking.

Find the best investment opportunities immediately

However, the Candlestick Forum RARE program dramatically simplifies that process. You, as an individual investor, probably do not have the time or resources to identify when a development or an announcement on a particular company can produce large profit opportunities.

Reverse engineering can be applied to candlestick signal scanning techniques. The process is very simple! Knowing that a technology improvement announcement or a merger of two companies can produce the potential of greatly improving a company’s market share, those events will be found immediately utilizing candlestick scans.

The appearance of a strong candlestick signal would warrant immediate reverse engineering, investigating what caused a substantial breakout price move. If a company announces news, it can be immediately evaluated to see what that news will do to the company’s future prospects.

For example, if the company announces they have just created a new lithium battery that would produce 800 miles per charge, or have produced a battery that is one half the weight of existing batteries, the bullish reaction will likely produce further upside potential for the stock price.

The Candlestick Forum RARE program allows investors to be immediately alerted when something new is occurring to produce a new dynamic in a specific sector. This greatly reduces the risk factor of investing funds into companies that might not come to the forefront of technology improvements. The Candlestick Forum RARE program takes the guesswork out of where a good profit trade can be established.

AND it is based upon very simple logic.

Technology’s parabolic trajectory

Back in the 1960s, it was stated that technology had advanced over the past 50 years more than all the advancements from the beginning of mankind up until the previous 50 years.

It would not be too far-fetched to think that technology has advanced more in the past 10 years than all of the advancements prior to 10 years ago.

Technology is leapfrogging. It is hard to even imagine what new technology will be presented over the next year. Having the ability, using the RARE program puts investors in a position to immediately recognize when new technology may affect the electric vehicle sector.

Currently, electric vehicles make up approximately 1% of the total automobile market. It is not out of the realm of possibility that over the next couple of years, that market share could move to 2% to 3%.

It is also conceivable that in the next few years, electric vehicles could take over an extremely large percentage of the automobile industry.

Candlestick analysis allows for the evaluation of strong short-term trades as well as long-term investments. Candlestick scanning techniques identify new investor perspectives in specific companies, producing short-term profitable trade situations.

If you, as an investor, are looking for ways to identify the best trades/investments in an industry? Candlestick analysis makes that process very simple. Join Us in identifying which industries are performing the best. Then identifying which companies in those industries are performing the best.

See for yourself! This is not rocket science. This is merely putting common sense investment perspectives into a graphic depiction. You will gain a whole new perspective on where the high probability/high profit trade set ups will occur.

ABOUT THE AUTHOR


Author: Stephen Bigalow
Company: Candlestick Forum
WebsiteCandestickForum.com
Services Offered: Trading Education, Books, Videos, Webinars, Indicators, Live Trading Room
Markets Covered: Options, Stocks, Forex, Futures

Chapter 12

Steven Primo | Specialist Trading

Two Trading Techniques for Volatile Markets

  • Benefits of being on the right side of the market
  • Importance of staying in sync with the short-term trend
  • How I use these techniques in my own personal trading

Chapter
12

Two Trading Techniques for Volatile Markets

By Steve Primo, SpecialistTrading.com

Hello, my name is Steven Primo and I have been actively trading the markets for over 44 years now - beginning as a 9-year Specialist on the floor of the Pacific Stock Exchange, to managing a private Fund. Later on in my trading career I held the position of Director of Education for a number of websites until I ultimately became the President and Founder of my own company, Specialist Trading, where I teamed up with Pro Trader Strategies to focus on one goal - that of educating traders around the world.

I have experienced and traded just about every market environment imaginable, from the Crash of '87 to the great Bull market that followed, but I've learned that one thing remains constant. Regardless of market conditions and regardless of what market you trade, most traders will blow out their accounts within the first year of trading. Please be aware that when I say "blow out" I do not mean they will sustain a series of losses. I mean they will actually lose their entire trading accounts. It's at this point that a prospective trader must make a decision - either to end his dream of one day becoming a successful trader, or to begin the long journey towards acquiring the insights, wisdom, and trading strategies needed in order to become a successful trader. The good news is that I've already made that journey for you. My goal is to shorten your learning curve by teaching you how to trade with the strategies and edges that I've already acquired within my 44 years of trading. My goal is to teach you how to trade with the Specialist's Edge.

In this article I will share with you two highly powerful yet simple Trading Components that I continue to apply to my own personal trading to this day.

Initial Set-Up Rules

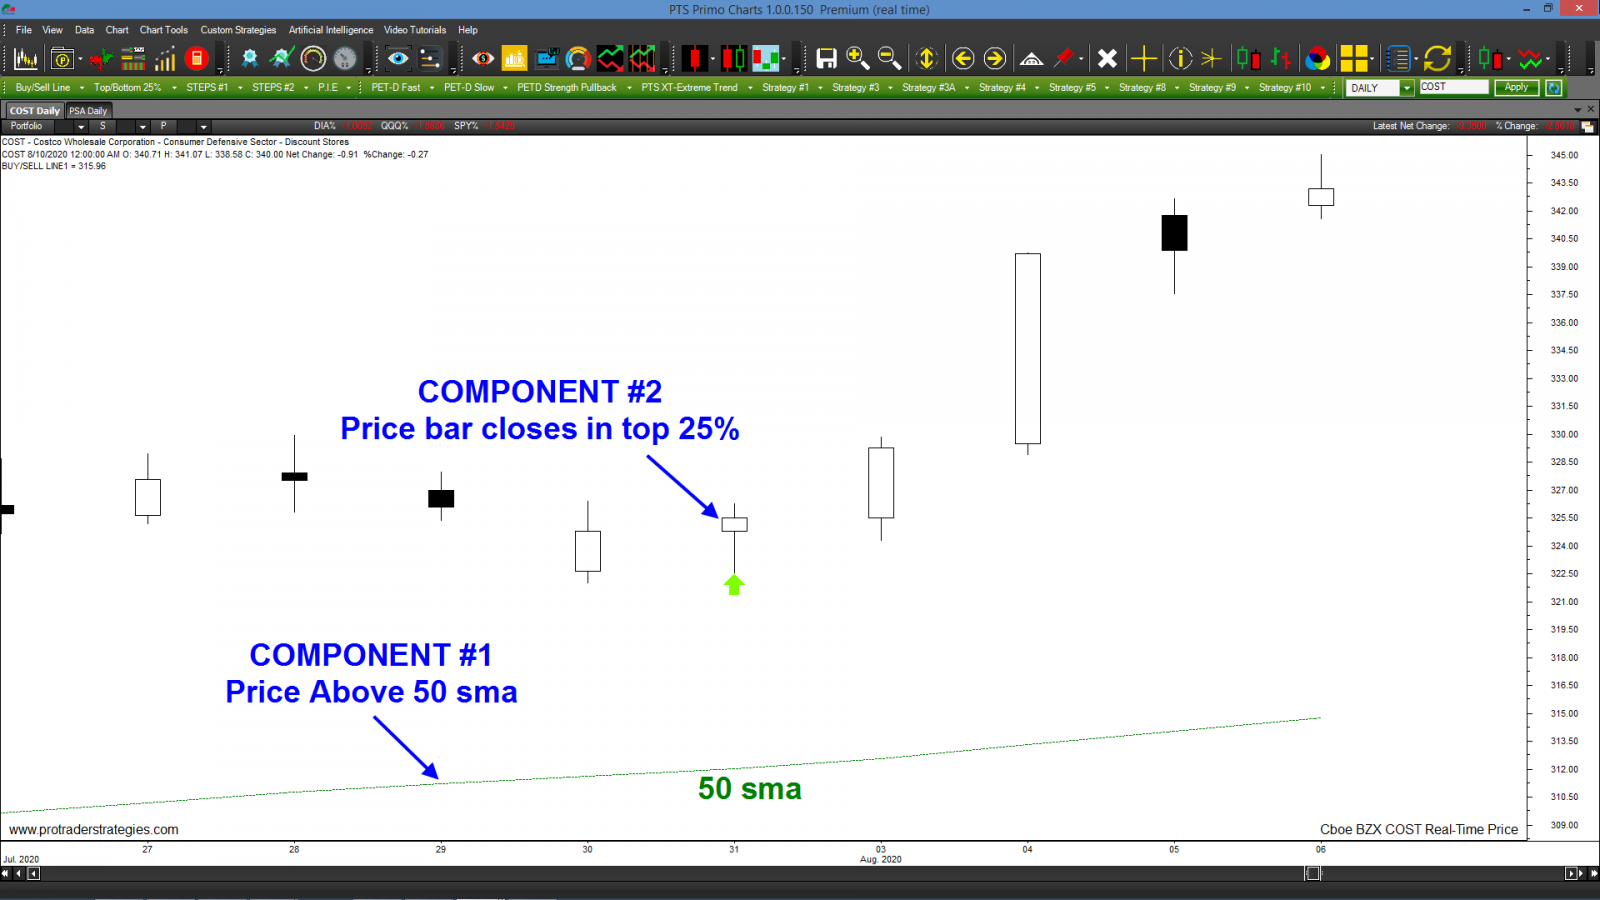
Indicator: 50-period simple moving avg. (Buy/Sell Line)

Component #1 Buy Set-ups: Price must close ABOVE the 50-peiod simple moving avg. (Buy/Sell Line)

Component #2 Buy Set-ups: Price must close in the top 25% of it's range

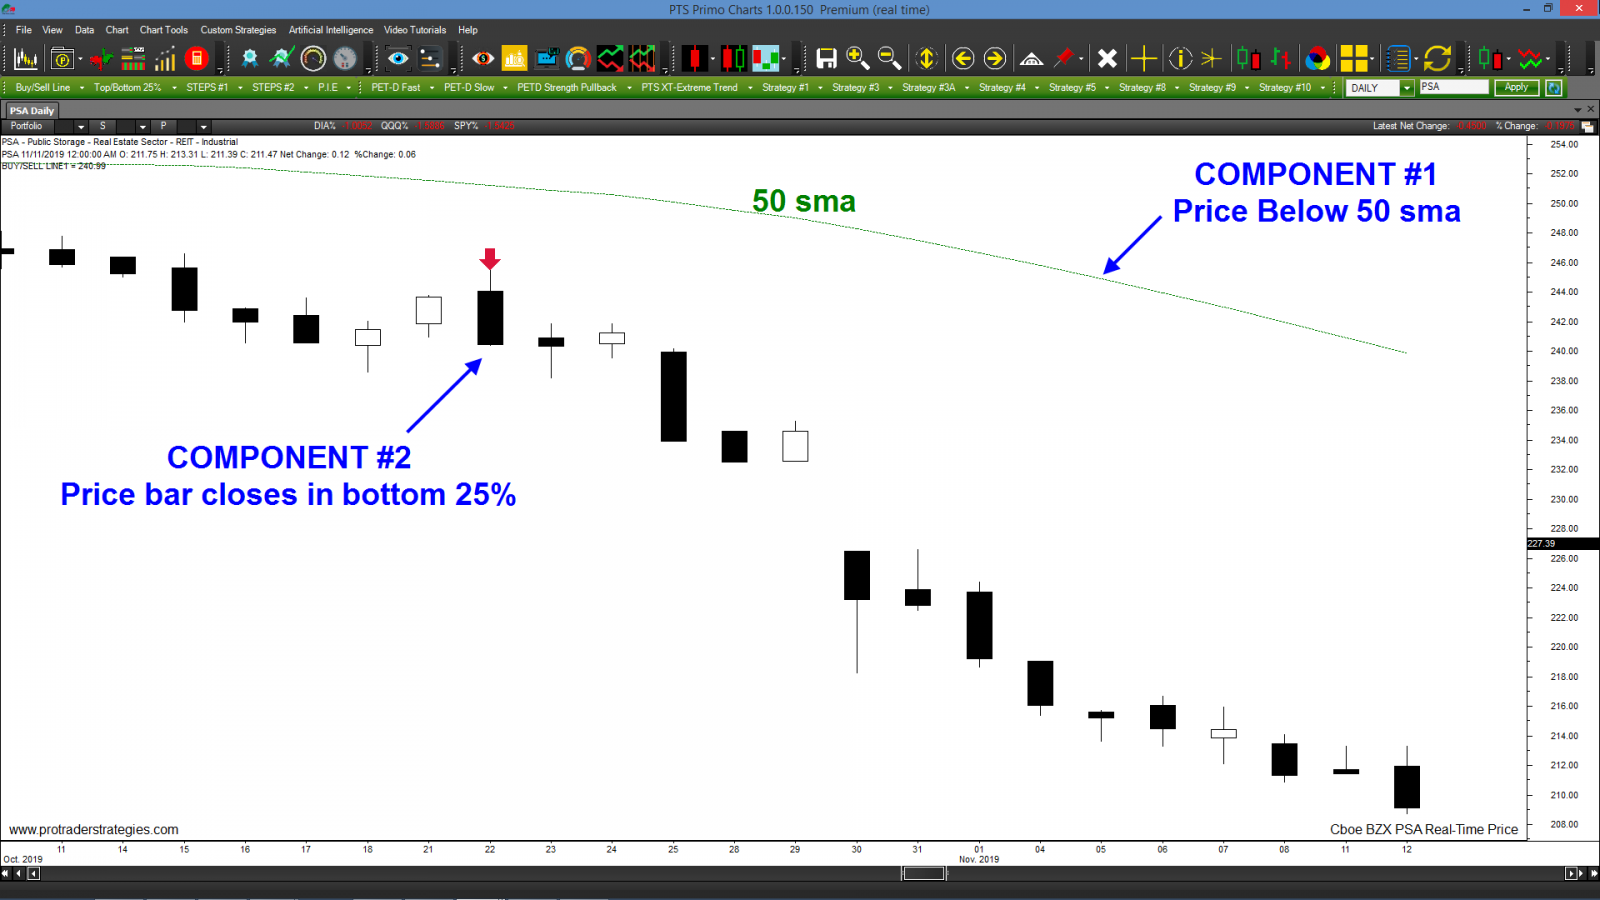
Component #1 Sell Set-ups: Price must close BELOW the 50-peiod simple moving avg. (Buy/Sell Line)

Component #2 Sell Set-ups: Price must close in the top 25% of it's range.

Buy Signals: Price is in an overall up trend mode above the 50 sma (Component #1). Look to buy when a price bar (Intra-day, Daily, Weekly) closes in the Top 25% of it's range (Component #2). This is the "Set-Up" Bar. Buy 1-tick ABOVE the Set-Up bar's high. This is called a "Confirmation" entry.

Sell Signals: Price is in an overall down trend mode below the 50 sma (Component #1).  Look to sell when a price bar (Intra-day, Daily, Weekly) closes in the Bottom 25% of it's range  (Component #2). This is the "Set-Up" Bar. Buy 1-tick ABOVE the Set-Up bar's high. This is called a "Confirmation" entry.

Summary

Ultimately, no method - regardless of what it's based upon or what market or time frame one decides to apply it to - will guarantee that all of your trades will be successful, but if you do decide to employ these Components I strongly feel that you will substantially increase your odds for consistency. Why? Because Component #1 is designed to put you on the right side of the overall market whereas Component #2 is designed to have you in sync with the short-term trend. Once you learn how to fully employ this entire process like the back of your hand then you will be trading with the Specialist's Edge.

ABOUT THE AUTHOR


Author: Steven Primo, Founder
Company: Pro Trader Strategies, Specialist Trading
Websites:  ProTraderStrategies.comSpecialistTrading.com
Services Offered: Trading Courses, Trade Signals, Member’s Section, Videos
Markets Covered: Stocks, Emini Trading, Forex, Day Trading, Swing Trading

Chapter 13

Vince Vora | TradingWins

Simple Technique for Trading Volatile Markets

  • Why simplicity and consistency is the key to success
  • My favorite simple strategy for trading with the trend
  • How simple moving averages can be your best friend

Chapter
13

A Simple Technique for Trading Volatile Markets

By Vince Vora, TradingWins.com

Most traders tend to overthink trades and make their analysis more complicated than it needs to be. They’ll keep adding indicator after indicator, in the hopes of finding the perfect system. Let me tell you, that perfect system does not exist. I know because I used to try to find it too.

In this volatile market, the key is simplicity and consistency. Watching the financial news is NOT a good idea because the talking heads on the networks are not looking out for your best interest. What you need is your own strategy, one that keeps you level-headed when markets are gyrating.

The simple strategy that's featured in this short video is based on the Guppy Multiple Moving Averages. And, it can be used for short-term trading (from 1-5 minutes) to longer investing periods that range from months to years.

In the field of technical analysis, your chances of success increase substantially when you are trading with the trend. Counter-trend trading is best left to traders whose appetite for risk is substantial. The Guppy system will help you quickly identify changing trends with simple moving averages. It's a system that anyone can learn and benefit from. Once you've identified a real trend, you'll see how you can confidently put on simple trades or use options to leverage your position and manage your risk.

THE MOVIE: A SIMPLE TECHNIQUE FOR TRADING VOLATILE MARKETS

ABOUT THE AUTHOR


Author: Vince Vora, Senior Trader
Company: Trading Wins
Website: TradingWins.com
Services Offered: Trade Alerts, Daily Market Commentary, Nightly Videos
Markets Covered: Stocks, options, Forex, Futures

Chapter 14

Mark Sebastian | OptionPit

Predicting Market Moves Using Volatility

  • Using volatility to spot the next big sell-off
  • Predicting short-term moves using volatility
  • Integrating volatility to improve long-term profits

Chapter
14

Predicting Market Moves Using Volatility

By Mark Sebastian, OptionPit.com

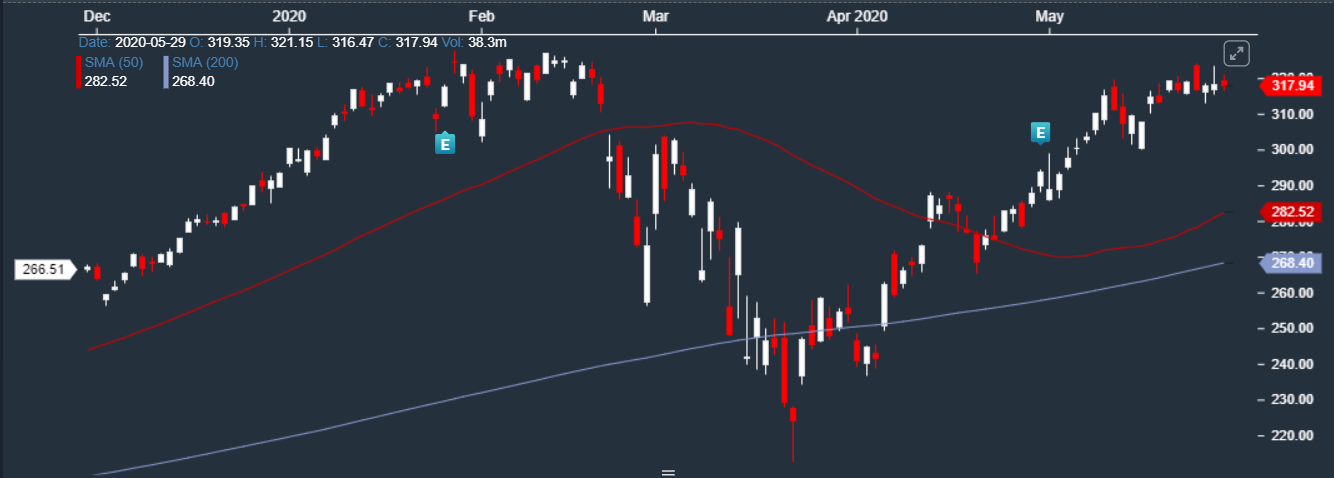
The market collapse of February and March of 2020 and the ensuing rally of April and May has taught us an important lesson…

Volatility when ignored will create utter chaos.  

To those that ignore volatility, there may be months or even years of blissful ignorance.  But eventually volatility will come and it will destroy portfolios. 

Here is the good news…

Paying attention to volatility does not mean gobbling up protection at such a rate that it swallows up returns.  Paying attention to volatility will not only allow the trader to avoid getting crushed when the market explodes, it will allow the trader to actually make MORE dollars on every trade…

through the power of options.

Options are not a leveraging project, they are an insurance product.  But…so is Geico.  Geico is the engine Warren Buffett uses to power Berkshire Hathaway.  While I do not have those types of deep pockets, I do have an understanding of options that will allow ME to show YOU how to use options to produce consistent profits. 

The key is volatility.

There are 3 types of volatility that are measurable in options.  Realized Volatility, Historical Volatility, and Implied Volatility.  While all 3 are important in understanding volatility, the one I want to concentrate on and teach you to use is implied volatility.

Implied volatility is best described as how much risk the market THINKS is in a stock.  Just like Geico insurance charges you a car rate based on how many accidents it THINKS you will get into in a year.

If Geico THINKS you will get into a lot of accidents, your rates will go up.  This can be because of moving to a new city,  because of new drivers in the house that are bad drivers (teenagers), or it could be, that even though it was TOTALLY someone else’s fault, you got into an accident.

On the flip side, if Geico thinks you are a safer driver, your rates will go down.

(I pretty much just explained implied volatility in about 4 sentences, how can this be an entire chapter?)

The answer if only traders got to price out 100 million option trades, it would be.  But they don’t.  At most a retail trader maybe prices out a couple of good trades a DAY. 

Geico can afford to be wrong, pretty often, because they insure A LOT of ‘trades’.  You, as a retail option trader, do not insure lots of trades.  If you are only doing a few transactions,  you cannot afford to be wrong NEARLY as often as an insurance company when buying and selling options (policies).

Thus,  in order to become a profitable options trader you must do every trade with an intent to make real dollars.  Every trade has to have a real advantage to you.  This is WHY you need to know volatility.  This is why you need to understand how to price an option.

Pricing the Option

When you want to buy or sell an option, the first and most important thing to determine is….how expensive are the options.

How do we do that?  It’s pretty simple, we look at a chart.

But not a stock chart.  We look at a volatility chart.  You probably already look at a volatility chart regularly.    How do I know?  Because you probably look at charts of the VIX.

The VIX is an index on volatility of the S&P 500 options.  It measures how expensive options are on the S&P 500.

But the S&P 500 is not the only thing that has an index. 

There are indexes listed by Cboe on close to 100 products.  Everything from FXE (Euro) to GLD (gold) to WTI (oil), there are even volatility indexes in a few individual equities like AAPL.

The beautiful thing about these 100 VIX charts is that they all have one thing in common.  They all mean revert.  This means they hold to an average.

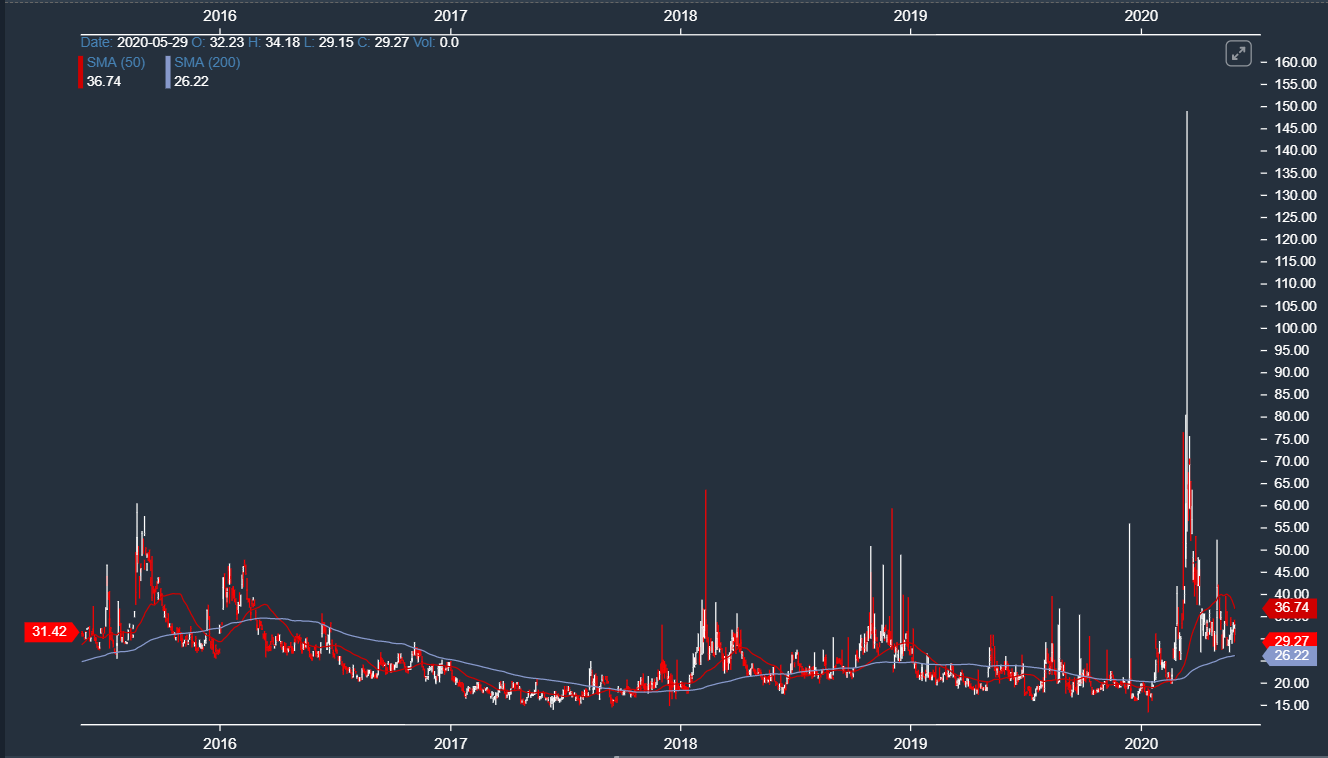
Volatility mean reverts in both the near term and the long term.  In the near term, when volatility has been at the low end of its historical range, it will rise and fall from week to week around a mean.   Let’s take a look at a chart of OVX. 

There is no doubt that oil implied volatility is high.  Even in a short period of time like a month, one can see that IV drops, then pops back, and then drops again.

This happens because volatility has inertia to it.  Things that are not moving tend to say NOT moving and vice versa.  In the chart above, volatility is ‘winding down’ lower after OVX hit an all time high.  But, in this wind down, the inertia pulls the IV back up.

IV, despite having a direction, is still pulling to mean revert. 

Could this be useful to us? 

Of course it can! 

When IV is within a trend or cycle I have a good idea of when I want to buy or sell options.

Let’s take oil for instance.  In the long term, I think Oil will probably be higher than it is currently.  I think most anyone can make that assumption, as the WTI traded below 0, not many other places for it to go.

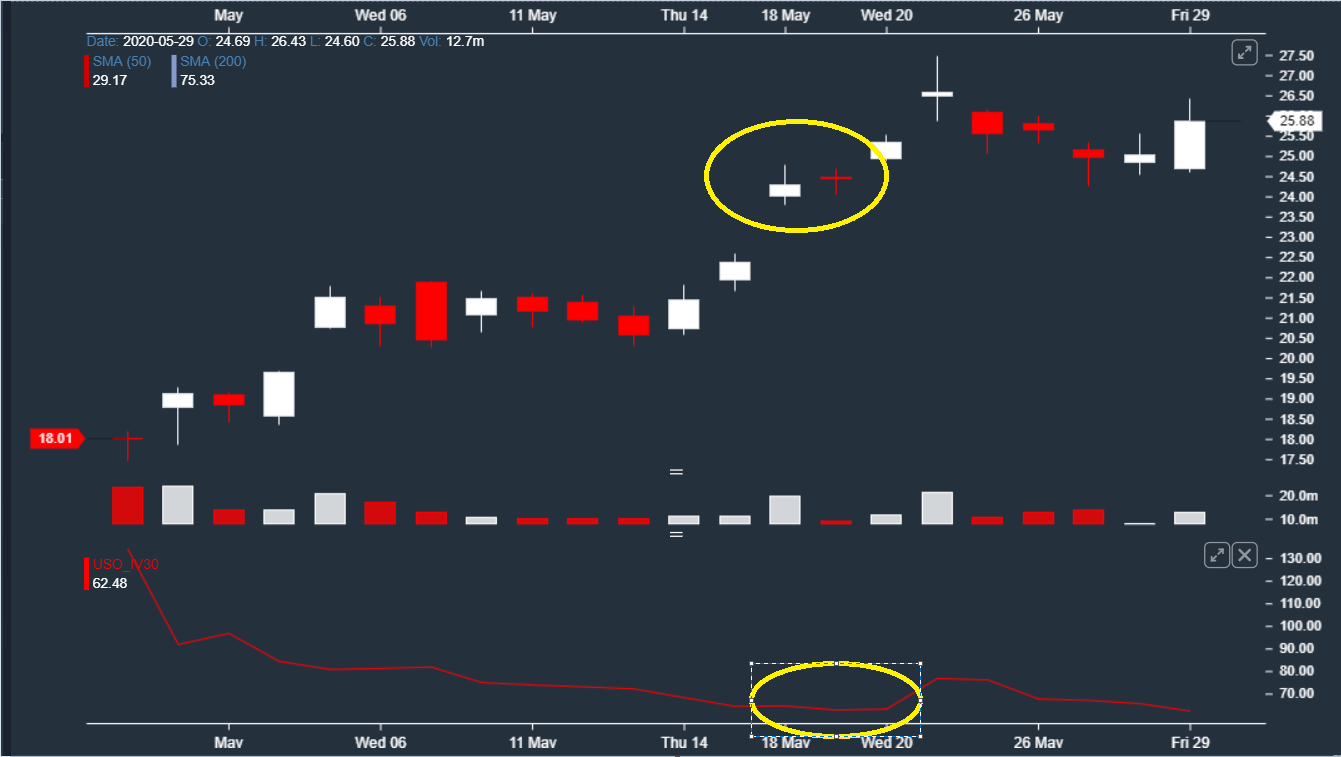
Now take a look at this chart.  On the top is a candlestick chart of USO.  On the bottom is a chart of IV 30, pretty much the same thing as OVX.  As USO is breaking out, and making a clear move higher, one can also see that IV30 is at a buyable point.

Thus despite the OVX being at 10 year highs, this was a moment where I actually wanted to buy options, not sell.

That is the crazy thing about trading volatility.  Price is relative to where it has been.  Think about it this way.  When AAPL was 260 dollars at the end of November, it did not seem that high, it did not seem ‘expensive.’

When AAPL  was $250 in February, to some, it felt expensive.  This is because we did not know how low it could go.  Near term price is relative.  Thus, when volatility is in a range it becomes tradable.  Actually, much more reliably so than say indicators that one might use on a stock itself.

So how do you trade volatility in the near term? 

The key is to have stocks that you know and follow.  Volatility actually has a feel to it and because it is mean reverting,  unlike many ‘technicals’ that came from a feeling, there is some truth to what you are feeling.

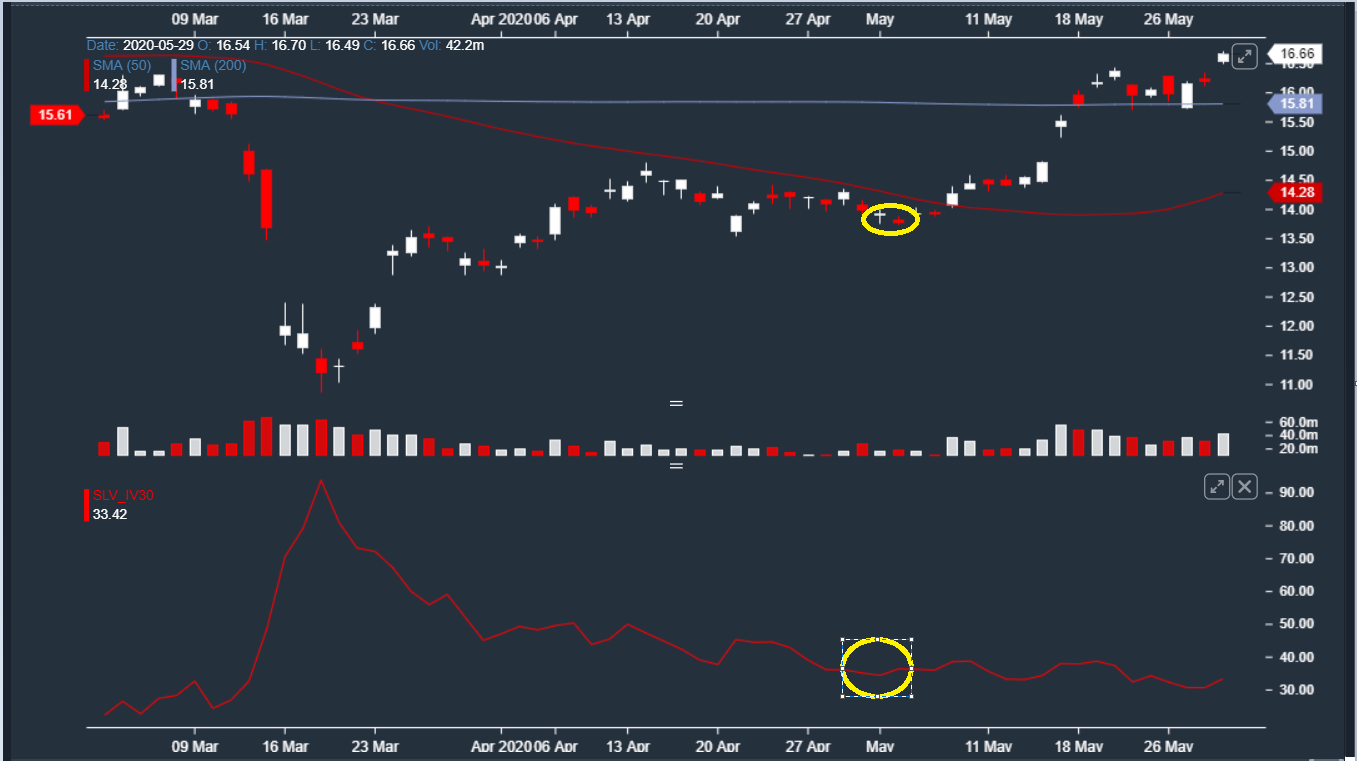
Let’s have a quick example using SLV, pulled directly from my Sharp BETS letter.

We thought SLV was too cheap for a host of reasons.  Then, looking at SLV option volatility (you could look at VXSLV if you don’t use LiveVolPro like I do). 

In early May,  we noticed that SLV IV was at the lowest level we had seen since the crisis, at the same time  SLV itself was near those lows. 

This was an opportunity to strike. 

We bought a call spread buying the 14 calls and selling the 24 calls.  Within a day the spread was up over 30%.  A few days later, we had closed over 75% of the spreads and we’re carrying spreads up about 80%. 

We noticed SLV because of the price.  We made the trade because of the implied volatility, the level of VXSLV.

The point of this is that when volatility is at a near term low,  EVEN if it might seem high, I trade it within the near term trend, NOT what it was months ago, even if I always have my eye on the long term volatility.

Long term volatility is also mean reverting and can help guide you in both near term trading and long term investing.

When I make my presentation in a few weeks I will dig into, in deep detail, how I use long term mean to trade volatility AND to make long term decisions for investing.

For traders and investors, I will walk through my volatility traffic light. 

Using my traffic light I make investing as easy a Red,  Yellow, and Green for my clients.

My readers KNOW if we are red, yellow, or green in the VIX, how they need to be trading the markets for maximum gains!

Mark

P.S. - Whein I make my presentation on Thursday, March 4, I will pull back the curtains on my proprietary indicators that allow everyday traders just like you capture quick gains in the market like I did as a real market maker.

ABOUT THE AUTHOR


Author: Mark Sebastian Founder
Company: Option Pit
Website: OptionPit.com
Services Offered: Trading Education, Training, Trade Room, Newsletters
Markets Covered: Stocks, Options