WestmarkTrading - Women in Wealth - Calm, Cool and Collecting Profits

Chapter 01

Wednesday | November 11th | 10:00 am ET

Matt Buckley | Top Gun Options

Best Post-Election Sectors & Stocks to Target

  • Why infrastructure stocks are set to explode
  • Reason why bank stocks will get hammered
  • The only tech stock you must own

Chapter
01

Best Post-Election Sectors & Stocks to Target

By Matt Buckley, TopGunOptions.com

With the elections now upon us, there has never been a more stark difference between the candidates. Love them or hate them, whoever gets elected will have a profound impact on the markets.

The relief rally from March through September has been Fed-induced, with the Federal reserve propping up the markets with monetary stimulus in the face of record unemployment. At the time of this video, Speaker Pelosi and Mnuchin are deadlocked in stimulus discussions and regardless of what happens, the markets are expecting some level of renewed stimulus.

But what will be the key sectors to watch? Sit back while I walk you through the top sectors to look at adding to your portfolio, as well as those you should be avoiding.

SHORT VIDEO PRESENTATION: BEST POST-ELECTION SECTORS AND STOCKS TO TARGET

ABOUT THE AUTHOR

Author: Matthew “Whiz” Buckley, Founder
Company: Top Gun Options
Website: TopGunOptions.com
Services Offered: Trading Courses, Mentorship, Trade Alerts
Markets Covered: Stocks, Options

Chapter 02

Wednesday | November 11th | 11:00 am ET

Josh Martinez | Traders Agency

Top 3 Election Cycle Mistakes Traders Make

  • Avoid getting caught up in the post-election backwash
  • 4 golden rules that should be in every Trading Plan
  • Using the Golden Cross to exploit market breakthroughs

Congratulations on taking this vital step towards enhancing your market research over the coming months! The 2020 presidential election is coming up in just a few short weeks, and many people will be entering the market in hopes of making higher than average returns from the volatility created during this election cycle. For experienced traders, the period after a presidential election can be extremely profitable, but people who are new to the markets can lose significantly.

That is the precise reason we created this report. We have collected a plethora of market research that covers the past 32 years, revealing an average historical market move of just over +/- 20% between the night of the presidential election and the following year, specifically on the E-Mini Russell 2000, Nasdaq 100, & S&P 500.

For example, the most recent election cycle caused a 30% increase in the S&P 500 from the night of the election to its first anniversary.  That equates to a 6,033 tick rise, or $75,412.50 when trading with one E-mini contract! Based on our research, we can expect significant market movements no matter who wins the election.


One of the keys to a profitable trading experience during a U.S. presidential election is to avoid making common mistakes. During our time as educators, analysts, and traders, we have narrowed down what we believe are the three most common mistakes people make while they invest during an election cycle:

  1. Risking too much
  2. Entering into a trade too early
  3. Deviating from their established trading plan

In this e-book, we'll break down in detail the three mistakes listed above. If at any time throughout this publication you require assistance or need help, please feel free to contact our support team Monday through Friday from 9:00 AM ET to 5:00 PM ET at 1-888-483-5161 or by email support@tradersagency.com

Trading Mistake 1 - Risking too much

Our emotions can have a considerable impact when we’re placing trades. The desire to make the most amount of money as fast as possible is common among traders. Both inexperienced and experienced traders fall victim to the pitfalls of this thought process and will frequently disregard proper risk management. And it's especially prevalent during an election year. Historically, market volatility increases considerably after the conclusion of an election cycle.

Check out the below example of the S&P 500. The chart tracks the seven months leading up to the last presidential election and the seven months following it. The post-election market showed more than double the amount of opportunity than before the election:

Some people view this opportunity as a "home run" and may consider overleveraging particular trades hoping for that one big payday. But they're not assessing the potential risk of such a trade. If a person risks all their money in a single transaction, one bad trade can wipe out their entire account.

Case in point: Right after the last election, we saw a market rally of 691 ticks within two weeks equaling $8,637.50 when trading one e-mini contract on the ES. If a person got overly excited and entered the market after the first bullish run with a full E-mini contract, they would have lost 110 ticks (or $1,375.00) when the market naturally pulled back. And if the trader's account didn't have enough cash, they would lose all their money from that one trade.

A surefire way to prevent losing everything in one fell swoop is by not risking your entire account in one transaction. As a trader, you must analyze your portfolio and determine your overall “staying power.” You can calculate that by finding the amount of losing trades you can take before your account balance reaches zero. For example, if a person were to risk a max of 2% of their entire trading account per opportunity, they could hit 50 bad trades before losing all of their funds.

Trading strategies are essentially investment formulas. Some methods can still generate net returns even though they lose 60% of the trades. That means a person would need to be able to withstand a minimum of four losing trades in a row before having an opportunity to generate profit. But if a person doesn't have that kind of staying power and risks 25% of their entire trading account per trade, four bad trades could empty their account.

When a trader is risking too much per trade and has very little staying power, the chances of that trader finding success, in the long run, is practically zero. It doesn't matter how great your strategy is. If you risk everything in a single trade, you can lose it all.

Trading Mistake 2 - Entering into the trade too early

The presidential election can be an exciting time for traders, which can sometimes trigger a "fear of missing out" reaction. That can cause people to enter the market too early or chase an opportunity that unintentionally increases risk. The image below shows what happened in the market the day after the 2016 presidential election. There were over 568 ticks of movement on the S&P 500, which provided an opportunity to make over $7,000 when trading one e-mini contract:

Such larger than usual market movements can be so exciting that a trader will often ignore their exit strategy. A person controlled by the fear of missing out can fall into the trap of guessing a U-turn and not trading it. Let's look at an example:

Let's say the current market direction is up. A trader then notices the market starting to fall. They understand that the current direction is up, but instead of waiting for the buyers to take control, the person will enter into the market while sellers are still calling the shots. When this happens, the trader is entering a trade position while still in a seller's market. That will inevitably lead to more drawdowns. The trader then exits the trade early, only to see the market trend up again. That person just lost out on a winning trade. It's one of the worst ways to lose money.

Here's another example: The S&P 500 had a four-month bullish trend, and the market was past due for a larger than usual pull back.  The downward trend finally started to form in March 2017 - it was a short-term downtrend because the long term trend was still bullish.

A person influenced by the “fear of missing out” would view the first pull back as an opportunity to buy a low price and ignore their entry strategy. They enter the market just because it is a low price. The market continues to fall for another 284 ticks, equal to $3,550 when trading an e-mini contract before finding the low and pushing bullish again. If the trader would have just waited for the U-turn, they could have avoided the drawdown and enjoyed making money.

Trading Mistake 3 - Deviating from the trading plan

Success is not a fantasy; it is a formula. During our years of educating and trading, we have developed many rules to achieve success. One of the primary rules we follow is "Plan the Trade and Trade the Plan." Before executing a trade, it's a good idea to review your plan. It is essential to plan the trade before placing the trade. We do this to help establish a good habit of following the rules. And if those rules shape a strategy that formulates success, you'll be making money more often than losing it.

As mentioned, our research has shown an average change in the market of just over 20% during the first year of a presidency. In the below example from the 2000 presidential election, the market saw a significant decrease by over 51% in the Nasdaq 100. Suppose a person sold the market after the election with an e-mini contract. Such a move would have resulted in 16,755 ticks, equal to $83,775.00.

It is essential to have a core set of rules in every trade to increase the odds of landing successful ones. The market only has two primary directions: up and down. There is a 50/50 chance of being right or wrong when making a trade if you close your eyes and guess the direction.  But by adding a set of definite rules to guide you, you can bend those statistics in your favor.

Below are four rules we like to follow that we believe can help you stack the odds in your favor when trading:

1.) Buy low in the buy zone

2.) Sell high in the sell zone

3.) Don’t buy future high prices

4.) Don’t sell future low prices

Below is a snapshot of the NASDAQ 100. You will see the market is making lower lows and lower highs. If a trader were to follow the above four rules,  they could draw a downtrend line and only sell high prices near the line. They would not buy the market, they would not sell the market at low prices, and they would not change the rules. They would only sell high prices near the downtrend line, thereby repeating their success. 
 

Inexperienced traders will often consider the most recent movement, ignoring previous data. Such traders would overlook the downtrend all together. From our experience, they would win the trades when they sell high in the downtrend, but lose when trying to buy the low prices in the downtrend.

While a trader doesn't have to abide by our above rules, it's imperative to have some concrete practices to stack the odds in a person's favor before placing a trade.

SUMMARY

Our extensive research has shown that presidential elections have the power to move the market significantly up to a full year after the election. According to our data, most markets tend to move more than 20% during this period, which can provide significant gains if traded correctly or significant losses if proper rules are not followed.

We've narrowed down what we consider the three most common trading mistakes traders will make during the election cycle. Risking too much, entering into the trade too early, and deviating from the trading plan are widespread mistakes made by traders, but can be overcome with the simple steps we've given.

The potential for rising volatility in the market should be an exciting time for traders in the futures market. Based on past research, we should expect to see the market move significantly over the next year thanks to the election. And if you follow along with what we've presented in this e-book, you'll be ready to jump in and start expanding your trading account!

ABOUT THE AUTHOR

Author: Josh Martinez
Company: Traders Agency
Website: TradersAgency.com
Services Offered: Trading Education, Trade Alerts, Trading Workshops
Markets Covered: Stocks, Options, Futures

Chapter 03

Wednesday | November 11th | 12:00 pm ET

Eddie Z| EZ Trading Computers

Is Your Computer Fast Enough to Trade With?

  • Why it’s important to trade with a fast computer
  • Finding out if your PC is good enough for trading
  • Features to focus on and ignore in a new computer

Hello, my name is Eddie Z, and I am a 33-year Wall Street veteran and a lifelong computer geek. As a full-time stock trader and geek, I have a developed a unique perspective on trading technology and have learned what it takes to have a super fast and reliable trading computer system. My goal in this guide is to pass that information on to you, so that you can succeed as a trader.

There are several companies on the internet selling “Trading Computerswith literally thousands of dollars of profit built into them. I am here to tell you that despite their slick websites, they sell nothing special. In fact, many times they confuse you and try to sell you things you really don’t need. What’s worse is that these people are not traders like us. They simply do not speak our language.

The purpose of this guide is to help you determine if your computer is really fast enough for trading.

So, at this point, you may be asking yourself:

  • What is a Trading Computer?
  • Why do I need a special computer for trading?  
  • Can’t I just use my existing machine?

A “Trading Computer” is a very fast, superior piece of technology, designed to maximize the trader’s ability to interface with the markets and make decisions in real time. The key qualities of a great Trading Computer are speed, reliability, after the sale service/support, and multiple monitors. 

The most important reason traders absolutely need a Trading Computer is to avoid something called “slippage”. Slippage is when you enter an order to buy or sell, and the price you get filled at is much different from what you expected. Generally, slippage occurs because the trader is using a mass-manufactured, lower-end computer that is not displaying price information in real time. This price data may be off by just a fraction of a second, but it’s enough to throw off your entire trading methodology. 

Have you ever been to a sports bar where they are showing the exact same game on both a High Definition TV and an old-school, regular TV; and the game on one TV is actually a second or so ahead of the other? Slippage is a very similar phenomenon, and it costs traders a bundle. 

Most traders don’t realize that mass-manufactured computers, and the mainstream processors from just a few years ago, just can’t keep up with today’s mega levels of streaming price data. So if you have a computer that is just 2 or 3 years old that you bought at BestBuy, most likely you are going to have data issues and bottlenecks.

That brings me to an important point: forget about going down to BestBuy, OfficeDepot or Walmart to buy an HP, Lenovo or Dell computer. These mass manufacturers use inferior components, inferior wiring and low-end motherboards in their systems; and their tech support outright sucks (unless you like calling call centers in the Philippines!). You will NOT save money buying one of these mass-manufactured machines. Additionally, most of the mass manufacturers only include a 1-year warranty. As for the kids who work at these retailers, they have NO IDEA what you need as a trader.

Instead, plan on having a system professionally built and customized for you. Believe it or not, having a system built for you will NOT cost you more in price than going down to BestBuy. In actuality, it will cost you less if you consider the cost of slippage, set-up, downtime, headaches and frustration.

SPEED: The biggest contributor to speed in a computer comes from a component called the Processor.  The Processor is the engine of the computer.

Traders need the most powerful processors on the market to optimize their trading software! Trading software is extremely resource intensive.

The processor needs to be able to handle the MASSIVE volume of real-time data points and information we take in through our internet connection as traders. Think of all the price data, tick data, time and sales data, historical chart data, as well as the myriad of other information that is streaming to our machines.

Your trading software, besides showing you quotes, has to take these thousands of data points per second and compute analytics, quantitative indicator computations (sometimes dozens) and draw charts that are changing dynamically - in real time.

Additionally, traders use their computers for dozens of other applications that are resource intensive such as online trading/teaching rooms that make use of GotoWebinar and Zoom. Online video streaming such as CNBC, Bloomberg or CNN are also extremely resource intensive.

Now add in any other applications you use such as Excel, Outlook, Chrome, Skype, etc. and you can see your processor has to manage a LOT of tasks.

So as a trader, you never want to skimp on processing power and speed.  

Think of the processor as the main engine of the computer. The more horsepower the processor has, the faster it can process data and streaming information, and the less chance you will have for slippage and slowness.

The ultimate measure of computer horsepower is found by running something called a CPU Benchmark Test. This like taking your car down to a special tuning shop and having them test EXACTLY how much horsepower is coming out of the drive train. (In the car world, this is known as a “Dyno Test” on a dynamometer.)

The minimum amount of “horsepower” a trading computer needs (and this is really the bare minimum) is a CPU Benchmark Score of 12,000. This number may mean nothing to you without anything to compare it to.

Just to give you an idea, Dell, as of this writing, is selling their new Inspiron 22 3000 Desktop with the Intel i5-8265U processor which has a disappointing benchmark score of just 7986.  This is NOT fast enough for trading. 

Remember, the minimum Benchmark Score required to avoid slippage as a trader is 12,000.

Your best bet is to check the EXACT amount of horsepower of your current computer by visiting this CPU Benchmark Test Page -> https://bit.ly/ezcputest .  I think you may be surprised to learn that over-the-counter; store-bought computers are almost always underpowered.

As of this writing, here are my top processor picks for Traders.  These are chosen for their power and speed as well as for their value. 

Processor Recommendations for Traders:

Processor:

Benchmark Score

Comment:

Intel Core i5-9400


12,800

Intel’s latest i5 is the first of its kind to generate this much speed. This processor sets the bar in terms a speed and value.

Intel Core i7-9700K

17,750

Intel’s New 8-Core Processor.  A huge jump in power from the previous edition.

AMD Ryzen 5 3600X

20,510

AMD’s direct attack on Intel’s Market share. A VERY fast CPU and Fantastic Value

AMD Threadripper 3990X

81,000

This is the Fastest Consumer Processor we have ever tested. AMD is giving Intel a run for its money


Intel vs. AMD

So at this point, you probably asking - “Which brand of processor should I choose?”

Years ago, I would have pointed you exclusively to Intel.  Intel had been the gold standard when it comes to processors in terms of power, speed and quality all the way up until the end of 2018.  Up until that point, AMD (formerly known as Advanced Micro Devices) focused exclusively on the lower-end of the computer market and on graphics cards. 

However, in 2019, all of that changed. AMD has gone directly after Intel’s market share by releasing some very fast processors at very attractive price points.  In our production facilities we have tested these new AMD processors with full force and I can honestly say they now make excellent products for traders.  Excellent enough that we are willing to warranty their products for a full 5 years!  AMD’s regular warranty is 3 years.

If you are old school or brand loyal then go with Intel.  They still make excellent products.  If you want more bang for the buck, AMD is the right choice.  With AMD processors you will get a lot more speed for the money and the amount you save can be used to upgrade the hard drives and memory.

In terms of speed, the Intel 9th Generation Core i5-9400 is the only Core i5 to ever make our list.  Any Core i3 or Core i5 with a lower number simply does not meet the benchmark score requirements.

All of the older AMD, Intel i3 and Intel i5 series processors are equivalent to 4-cylinder car and you won’t have the power you need to do everything you want in the markets. 

I must repeat: the benchmark score is the ultimate measure of performance. The higher the benchmark score the better for you as a trader.  The minimum benchmark score for traders is 12,000.  

Check your computer’s benchmark score NOW by going here -> https://bit.ly/ezcputest .

The following processors are obsolete and should NOT be used by traders: Pentium, Pentium 4, Pentium Dual, Core2 Duo, Core Duo, Dual Core, Celeron, Core2 Quad.  Even lower-number i7’s (like the i7-2600) and any i7 with a U at the end (i.e. i7-7600U) are NOT fast enough to trade with and should be avoided.  Advanced Micro Devices (AMD) has many lower-end chips, too.  DO NOT BE FOOLED.  They must all have a benchmark score over 12000 or you are wasting your money.

ABOUT THE AUTHOR

Author: Eddie Z, Founder
Company: EZ Trading Computers
Websites: EZTradingComputers.net, EZBreakouts.com
Services Offered: Custom-Built Trading Computers, Trading Education, Stack Market Direction Calls
Markets Covered: Stocks, Options

Chapter 04

Wednesday | November 11th | 1:00 pm ET

Roger Scott | WealthPress

The Robin Hood Effect

  • How to profit during volatile market conditions
  • Retail trading at sky high rates send stocks soaring
  • Perfect trading opportunity for election season

The U.S. presidential election is coming up fast, and many traders and investors are searching for the safest — and savviest — investment opportunities.

But during election season, the stock market tends to trade sideways due to different economic policy proposals. And in our case, we have two presidential candidates with polar opposite viewpoints.

That means some profitable sectors and industries that have been thriving over the past four years may no longer continue to trend upward… and vice versa!

And no matter how we slice it, the market is entering a high-level of uncertainty…

That’s why we need to look for outside-of-the-box opportunities that should continue to gain regardless of which way the upcoming election goes. The two defensive ETFs I’m revealing in today’s video are proven to be great choices.

SHORT VIDEO PRESENTATION: THE ROBINHOOD EFFECT

ABOUT THE AUTHOR

Author: Roger Scott, Founder
Company: Wealth Press
Website: WealthPress.com
Services Offered: Trading Courses, Mentorship,
Markets Covered: Stocks, Options, Futures, Forex

Chapter 05

Wednesday | November 11th | 2:00 pm ET

Jeff Tompkins | Altos Trading

The Challenges Trading Election Volatility

  • Effect post-election uncertainty will have on markets
  • Best metric for gauging volatility in the market
  • Momentum indicators that predict market direction

The markets can become extremely volatile around presidential elections largely due to the fact that markets do not like uncertainty.

For example, on November 8, 2016 as a Trump victory became increasingly evident, the S&P 500 futures tanked by more than 5% in after hours trading. And then on November 9th, the S&P closed up over 1%.

So-called “experts” predicted that if Trump won in 2016 that there would be an instant recession and severe bear market.  Instead, the S&P index returned an average of 14% annually over the next 3 years and volatility had subsided until the advent of COVID-19.

Bottom line, volatile markets can be extremely difficult to trade as these two charts clearly show:

Before we can trade volatile markets, it’s important to first understand how volatility is measured and made available to us:  

  • The VIX “fear gauge” is the ticker symbol for the Chicago Board Options Exchange's CBOE Volatility Index, a measure of the stock market's expectation of volatility based on S&P 500 index options

  • Volatility measures the frequency and magnitude of price movements that a security experiences over a specified period of time. The more extreme the price swings in the security, the higher the level of volatility.

  • The VIX Index is a measure of expected future volatility and estimates expected volatility by aggregating the weighted prices of S&P 500 Index puts and calls over a wide range of strike prices. The prices used to calculate VIX Index values are midpoints of real-time SPX option bid/ask price quotations.

  • VIX Greater than 20 = Volatile Market

  • VIX Less than 20 = Normal Market Conditions

In addition, it is also critical to be able to predict potential market direction, especially during periods of market volatility.  One way to do this with consistent results is to use momentum indicators

Linear momentum is one of the most reliable ways to predict a security’s future price. Whether it is a stock, exchange traded fund (ETF), index, futures contract or Forex pair, momentum tells us who is in control- the bulls or the bears. It gives us a reliable indicator of which way the market is headed and when a new trend is setting in or an old trend is reversing. Imagine having access to this knowledge before placing your next trade. In this article, I will explain how you can accurately gauge future market direction and place more confident trades in any market and any timeframe.

First, let’s examine what linear momentum is and how it exhibits predictive qualities in the markets. In physics linear momentum is defined as the product of a system's mass multiplied by its velocity. Momentum is directly proportional to the object's mass and its velocity. Therefore, the greater an object's mass or velocity, the greater its momentum. When applied to the markets, we can replace the variable “mass” with the catalyst of buying and selling pressure. Once we determine whether buyers or sellers are moving prices, we can more confidently place our trades and stay on the right side of the predominant trend.

There are dozens of “momentum indicators” available on today’s retail trading platforms. Some are more reliable than others. There are also many ways to interpret the data from these indicators and implement the output when placing a trade or incorporating the information into a trading system. Ultimately, we want a momentum indicator that tells us the strength, direction, momentum, and duration of the trend in a security’s price. There is one particular indicator available on virtually any retail trading platform that does an incredible job at accomplishing all of these metrics: the MACD.

The MACD indictor, which stands for Moving Average Convergence/Divergence, is a trading indicator originally created in the late 1970s by Gerald Appel and used in the technical analysis of security prices. Appel designed this indicator to reveal changes in the strength, direction, momentum, and duration of a trend in a stock's price. Not only is this indicator accurate and versatile, it can be applied to any market and any timeframe the trader chooses. While there are numerous ways to apply this momentum indicator, such as through divergence of the averages from the security’s price or to identify overbought/oversold conditions, one of the most reliable techniques to determine future trend momentum is the MACD cross.

The MACD is comprised of a 26-period Exponential Moving Average (EMA) and a 12-period EMA. By subtracting the 26-period EMA from the 12-period EMA, you get the MACD line. A 9-period EMA of the MACD called the "signal line," is plotted on top of the MACD line, which provides the buy and sell signals. In other words, the MACD cross indicates a shift in momentum when the fast line crosses above or below the slow line.

Let’s look at this on a daily chart of Apple, Inc. (Ticker: AAPL):

We can see the MACD cross that took place in early June when the signal line passed the MACD line following a steep sell-off, resulting in a buy setup. Over the next couple of months shares of Apple, Inc. rallied nearly 24%.  In this scenario the MACD cross proved to be a very accurate indicator in terms of identifying the momentum shift and predicting a change in trend.

The MACD can also be combined with other momentum indicators and price action to add a layer of confirmation to trading decisions. To learn how you can use a proprietary blend of momentum indicators to reliably predict trends in any market and any timeframe, visit www.tradetrend.com.

ABOUT THE AUTHOR

Author: Jeff Tomkins, Founder
Company: Altos Trading
Website: AltosTrading.com
Services Offered: Trading Software, Coaching, Trading Courses, Trade Alerts
Markets Covered: Stocks, ETFs, Options, Futures, Currencies

Chapter 06

Wednesday | November 11th | 3:00 pm ET

Steven Primo | Specialist Trading

How to Leverage Volatility in Today’s Markets

  • Two rules of my most consistent trading strategy
  • Can be applied to any market and any time frame
  • How I use these rules in my own personal trading

What if I told you that all that was needed to increase your trading consistency during volatile markets was to simply change the settings of a very common indicator? And what if I said you could begin applying this method as early as today? Join Steven Primo, 42-year trading veteran and former Stock Exchange Specialist as he presents "Leveraging Volatility - Best Best Strategy For Today's Markets."

This is Steven's premier continuation strategy that can be applied to any market and time frame. In this presentation Steven will not only reveal the entry rules to this method but also show you recent examples of this strategy in action. Whether you are a skilled investor or new to trading, you can't afford to miss this educational presentation.

THE MOVIE: HOW TO LEVERAGE VOLATILITY IN TODAY'S MARKETS


ABOUT THE AUTHOR

Author: Steven Primo, Founder
Company: Pro Trader Strategies, Specialist Trading
Websites:  ProTraderStrategies.comSpecialistTrading.com
Services Offered: Trading Courses, Trade Signals, Member’s Section, Videos
Markets Covered: Stocks, Emini Trading, Forex, Day Trading, Swing Trading

Chapter 07

Wednesday | November 11th | 4:00 pm ET

Larry Gaines | Power Cycle Trading

An Option Strategy for Uncertain Markets

  • Option Butterfly Strategy works well in today’s markets
  • Benefits of using butterflies to generate low risk income
  • Butterfly setup and most important factor to focus on

The Option Butterfly provides a [low risk - high reward] trading opportunity that can be used to trade any market environment, but it’s this dynamic option strategy that’s my Go-to-Trading Strategy for Uncertain - High Volatility Markets.

Markets can go through months, and even years of higher than usual uncertainty. Technical analysis may be painting one picture, while the economic or political environment is painting another. This can be both stressful and costly. But the Butterfly strategy offers a solution to this dilemma that all traders face on a regular basis. 

While there’s always some degree of uncertainty that traders and investors must accept, there can be long frustrating periods of higher than usual conflicting signals. This increases risk for traders and investors. Yet, waiting on the sidelines has opportunity costs. For traders who have come to rely on regular income from trading, loss of that income can cause serious lifestyle problems. These situations call for a strategy that will work no matter which direction the market heads.

That’s exactly what the highly versatile Butterfly strategy does. It gives you a trading advantage in any type of market environment. This makes it a powerful strategy that every serious trader will want to add to their arsenal of skills.

Many traders know of the advantages of the Butterfly, yet they may have avoided it because of its complexity. Initially, the setup can seem overly complicated. This is because most traders try to master the Butterfly without truly understanding a few basic option trading principles first.

In this presentation, I’m going to simplify the Butterfly for you. The reality is that once you grasp these basic concepts, you’ll see that the Butterfly is just marrying a couple of simple setups that you probably already know.

Serious traders take the time to master these skills to increase their returns while lowering their risk and the Option Butterfly is one powerful way to do this.

Since many traders avoid the Option Butterfly, by taking time to master it is going to give you a powerful edge up on traders who continue to avoid it.

Here is what you’ll learn

  1. Best Market Conditions for Butterflies
  2. Benefits of Butterflies
  3. The Option Greeks You Need to Know First
  4. The Most Important Option Factor         
  5. The Butterfly Setup

I. Best Market Conditions for Butterflies

Unlike other option strategies such as iron condors, credit spreads, or debit spreads that only work with an identified objective based on probable market direction, Butterflies can be set up and traded for a variety of objectives based on where a trader thinks the security or market is headed, as outlined below. One of the best things about Butterflies is that they are ideal regardless of market direction!

1. You Just Don’t Have Any Idea Where the Market is Headed

Non-Directional – Here’s the real beauty of the Butterfly! In their simplest form, butterflies can be delta neutral or non-directional trades. This means they can be used successfully when you simply DO NOT KNOW the market direction. Trying to pick the direction of stocks or the overall market can be stressful and expensive. Delta neutral butterflies can be set up to take the guesswork out of trading.

2. You Feel Pretty Sure the Market Is Headed Up or Down

Directional – The Directional Butterfly Spread can also be used for bullish or bearish exposure to the market while also managing risk and retaining large potential returns.

There’s no such thing as a free lunch: Butterfly spreads cannot offer unlimited profit potential. But they usually cost less than buying options outright while providing a powerful positive risk reward trade set-up that simply cannot be found with other trading strategies. 

3. You Don’t Want to Lose Your Shirt!

Hedging – The Directional Butterfly can be used as a fast to execute hedge on positions that are moving against you. This is exactly what the most sophisticated companies do. They hedge, and so can individual traders! Note: This lowers trading stress!

Constructing a butterfly around a strike that is under pressure from another core trade (such as a credit spread or debit spread) controls risk.

This allows you to keep the original position open, buying time. Often, additional time is all that’s needed for a trade to move back to profit territory. At that point you can then remove the butterfly hedge and stick with your original trade.

Butterflies provide cheap protection! Many longer-term investors and swing traders buy puts for portfolio insurance. Long term out-of-the-money put butterflies, however, can be a much cheaper method of portfolio protection than pure long puts.

II. Benefits of Butterflies:

Income - Butterflies can be used to generate income from stocks that appear to be going nowhere in the short term. This alleviates overall portfolio returns in flat markets.

Low Cost - Butterflies can best structured and traded at a very low cost.

Risk Reward - A 10-to-1 or higher Reward-to-Risk is common. This fantastic risk reward ratio makes them well worth the effort to learn the structure.

Low Maintenance – Butterflies are sometimes called “vacation trades” due to their low risk and need for only very infrequent monitoring.

  • Butterfly trades are generally very slow moving early on in the trade.
  • But get more exciting and volatile as they approach expiration and  are within the profit tent (Zone).

III. The Option Greeks You Need to Know First

The "Greeks" provide a way to measure the sensitivity of an option's price to quantifiable factors. The Greeks are strictly theoretical. That means the values are projected based on mathematical models and all of the best commercial options-analysis packages will do this, and on some of the better brokerage sites they are free.

Brief Review of the Greeks

Theta – (decay movement) measures your time decay (per day) – increases each day as it gets nearer EXP. & at zero at EXP.

Implied Volatility – (price movement) what the marketplace is “implying” the volatility of a stock will be in the future & its effect on where price will be

Delta – (price movement) measures the change per $1 change in the underlying & a measure of price probability

Vega – (volatility movement)measures the change per 1% change in volatility, decreases each day & at zero at EXP.

Gamma – (price movement)is the rate of acceleration of delta based on a $1 change in the underlying – most at risk & largest impact last week of EXP.

IV. The Most Important Option Factor

The most important option factor for profit generation using the Butterfly Strategy comes down to understanding the concept of TIME, and its effect on the price of an option…

Time Value ~ is used for trading strategies that take advantage of the accelerated Time Decay of an option into its Expiration.  Butterfly Strategies are very tied to Time Value (Theta) & the impact it has on the price of an option.

What exactly is Time Value?

Time value (TV) (extrinsic) of an option is the premium a rational investor would pay over its current exercise value (intrinsic value), based on its potential to increase in value before expiring. This probability is always greater than zero, thus an option is always worth more than its current exercise value. The change in the value of an option, based on Time Decay, can be measured using the Greek, Theta…

Option Theta

Theta tells you how much an option’s price will diminish over time, which is the rate of time decay of a stock’s option.

Time decay occurs because the extrinsic value, or the Time Value, of options diminishes as expiration draws nearer.

By expiration, options have no extrinsic value and all Out of the Money (OTM) Option expire worthless.

The rate of this daily decay all the way up to its expiration is estimated by the Options Theta Value.

Understanding Option Theta is extremely important for the application of option strategies that seeks to profit from time decay. 

Options Theta – Characteristics

Option Theta values are either positive or negative.

All long stock option positions have negative Theta values, which indicates that they lose value as expiration draws nearer.

All short stock option positions have positive Theta values, which indicates that the position is gaining value as expiration draws nearer. 

Theta value is highest for At the Money (ATM) Options

And progressively lower for In-The Money (ITM) and Out-of-The Money (OTM) options.

ITM and OTM options have much lower extrinsic values, giving little left to the decay.

For Example:

An option contract with Option Theta of -0.10 will lose $10 per contract every day even on weekends and market holidays.

The buyer/holder of an option contract over a 3-day long weekend with a price of $1.40 or $140 per option contract and an option theta of -.10 will find the price of that option at $110 instead of $140 after the 3-day weekend.

Theta Decay Strikes!

Option theta does not remain stagnant.

It increases as expiration draws nearer and decreases as the options go more and more In-The-Money or Out-of-The Money.

In fact, the effects of Option Theta decay is most pronounced during the final 30 days to expiration where theta soars. 

Take a look at the following chart to see just how predictable and powerful this option paradigm is!

During my presentation, I will walk through all of the specifics of setting up Options Butterfly trades, including examples and profit calculations.
 

ABOUT THE AUTHOR

Author: Larry Gaines, Founder
Company: Power Cycle Trading
Website: PowerCycleTrading.com
Services Offered: Trading Courses, Bootcamps/Coaching, Custom Indicators
Markets Covered: Stocks, Options, Futures

Chapter 08

Wednesday | November 11th | 5:00 pm ET

Vince Vora | TradingWins

Trading Around Election Volatility

  • Using price bars to easily measure market volatility
  • Hedging your current positions with Index puts
  • Protecting long term positions in the face of volatility

With the presidential elections upon us, I would like to share with you how I like to trade the volatility that is certain to occur.

First, lets begin with where the markets are at present. The markets have rebounded to near all-time highs, and appear to be heading further up.

As we head closer to elections, volatility is likely to pick up and could peak shortly after the election is over.

In this short video, I will share with you how I plan to trade volatility during the election.

SHORT VIDEO PRESENTATION: TRADING AROUND ELECTION VOLATILITY

ABOUT THE AUTHOR

Author: Vince Vora, Senior Trader
Company: Trading Wins
Website: TradingWins.com
Services Offered: Trade Alerts, Daily Market Commentary, Nightly Videos
Markets Covered: Stocks, options, Forex, Futures

Chapter 09

Thursday | November 12th | 10:00 am ET

Richard Krugel | Price Action and Income

My Top Tool for Predicting Future Price

  • Formulated way for predicting massive market moves
  • Capturing consistent gains that always outweigh risk
  • Using this approach in any market and any timeframe

I’m about to show you my favorite trading tool (one that might be collecting dust in your platform), and share my formulated approach for using it to predict massive market moves with precision.

And, even though it took me years of trial and error to figure it all out, I’m going to prove that virtually anyone can leverage this approach to capture consistent gains that always outweigh your risk.

This tool is accurate in any market, by the way, and you should pick up a few techniques you can apply to your own trading right away…

SHORT VIDEO PRESENTATION: MY TOP TOOL FOR PREDICTING FUTURE PRICE

ABOUT THE AUTHOR

Author: Richard Krugel
Company: Price Action & Income
Website: priceactionandincome.com
Services Offered:Training Courses and Trade Alerts
Markets Covered: Forex. Futures, Options

Chapter 10

Thursday | November 12th | 11:00 am ET

Geof Smith | Diversified Trading Institute

Solar, Currency or Gold - Which One Wins?

  • Will the rally in solar stocks continue?
  • Is the US Dollar going to be bullish or bearish?
  • Should we be buying on gold’s weakness?

Regardless of who wins the 2020 Presidential Election, the Renewable Energy markets appear well positioned to start heading higher with a focus on solar, batteries, and other more overall efficient technologies. The Fossil Fuel markets have been hard hit by decreased demand during the Global Pandemic shutdown and climate change pressures, but may also see some stimulus, especially if President Trump is re-elected.

Currency Markets, with a specific focus on the USD, have been lively largely due to past COVID stimulus programs and the potential for another stimulus package in the near future. These stimulus efforts have weakened the USD against other prominent currencies, and will this lead to an inflationary trend or potential depression?

The Gold markets will also be affected by the same external events that drive the currency markets. Additional stimulus programs and a weakening dollar are all situations that will drive gold prices higher, especially as hedge against increased inflation potential.

SHORT VIDEO PRESENTATION: SOLAR, CURRENCY OR GOLD - WHICH ONE WINS?

ABOUT THE AUTHOR

Author: Geoffrey A. Smith, Chief Instructor and CEO
Company: Diversified Trading Institute
Website: DTItrader.com
Services Offered: Trading Education,  Software, Trade Alerts
Markets Covered: Stocks, Options, Futures, Forex

Chapter 11

Thursday | November 12th | 1:00 pm ET

Jack Carter | Superior Information

Trading Weekly Options in Volatile Markets

  • Generate weekly income regardless of market condition
  • How to determine the best underlying stock to trade
  • Placing a hedged trade that will yield consistent results

Trading weekly options can be a great way to generate consistent weekly income, but the key is to learn how to trade them the right way. In this discussion, you will learn how most people trade weekly options and why they fail. Next you will learn a simple strategy for trading weekly options that can consistently put money into your account on a weekly basis.

Weekly Options

“Weekly options are the biggest game changer for the independent investor since the invention of the Internet.”

And now, thanks to three recent changes in the options market, you can get an even bigger advantage. Here’s why. The first big change:

1. The invention of weekly options. Normal options are listed in months. You can buy and sell stock options several months out in time. Weekly options expire weekly. These weekly options give you a new way to trade.

2. Weekly options volume has soared. When weekly options first got traction back in 2010, they were small in scope and volume. But by 2020, weekly options volume skyrocketed. This gives you a liquidity advantage.

3. The number of stocks with available weekly options has grown. The list of stocks is at the point where you can now find several great weekly options trades, regardless of market conditions.

As a result of these changes, you get great liquidity and more available trading opportunities with weekly options.

How to Make Weekly Income with Weekly Options in Any Market Condition

After losing my own money early in 1984 as a stockbroker, I went on to find success with options after working as a hedge fund trader. From this experience, I can save you a lot of time and lost money right now.

At some point in your journey, if you don’t get wiped out along the way, you’ll discover that there are definitely winners and losers in the options market. The reason is because options are a “zero sum” game.

But it’s simpler than that. Here’s why:

When you own a stock, you can own it forever.

But when you own an option, it’s only good for a certain amount of time, until expiration. And the cold hard truth is that most options expire worthless.

The reason is because options buyers run out of time.

This means options buyers lose all their money most of the time.

The real money in the options market is in selling options.

The odds are in your favor, simply by being an options seller.

Weekly options give you a huge edge because they expire every week.

This means you can make weekly income selling weekly options that expire worthless.

But how can you make it work?

There are three parts to this:

Part 1. The stocks

Part 2. The options

Part 3. The strategy – getting paid

Part 1:  The stocks

This is the most important part. Not all stocks have available weekly options.  And the ones that do aren’t always good to trade.

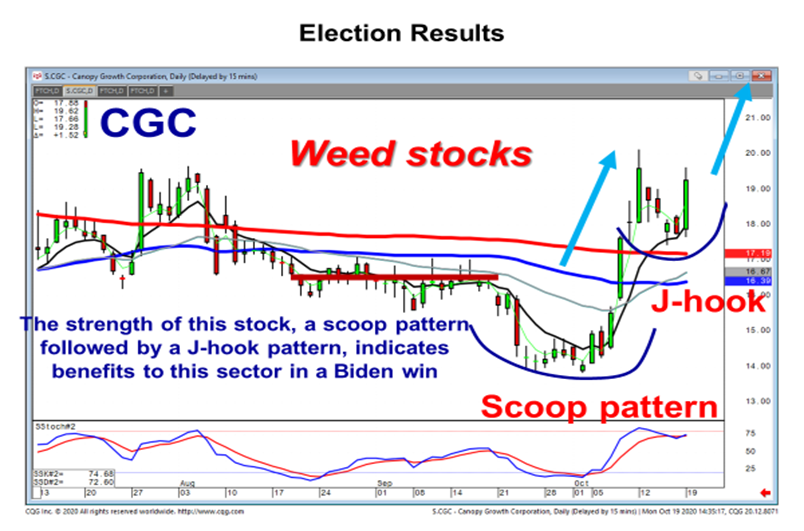
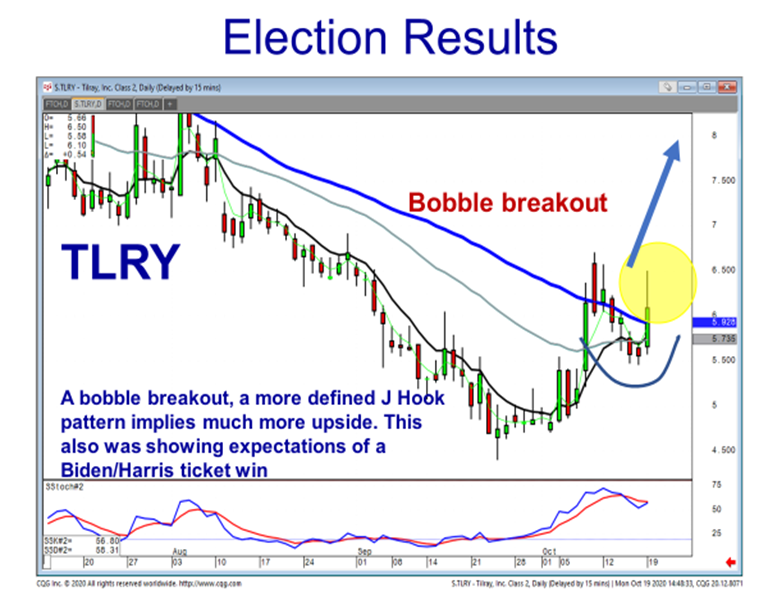
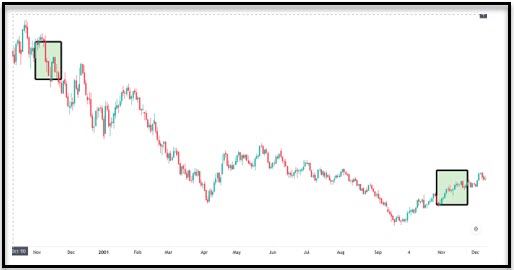
First and foremost, we want a stock with available weekly options that’s in a good trend. We take the list and look at each stock with available weekly options and narrow it down to three to five of them that are in good trends.

Part 2:  The options

There are only two types of options, puts and calls. And there are only two things you can do with options—you can buy puts and calls or you can sell puts and calls. If you buy a put option, you own the right to “put” the stock to someone at the strike price until expiration. If you sell a put, you sold someone the right to “put” it to you at the strike price until expiration.

If you buy a call option, you own the right to “call” the stock away at the strike price until expiration. If you sell a call, you sell someone the right to “call” it away from you.

Part 3: The strategy

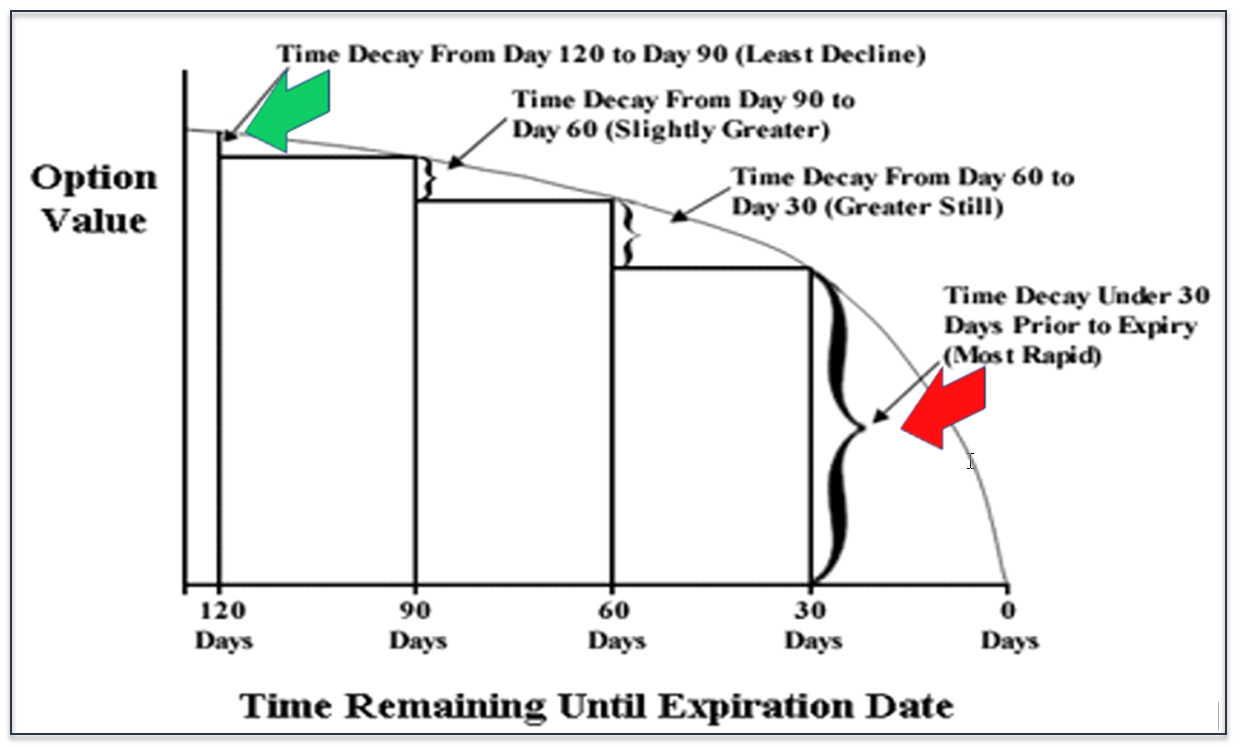
I’ve already given you the million-dollar secret to making money with options—be an options seller. The reason is because most options expire worthless. Time decay is what makes them expire worthless.

So, we profit by selling options while they still have some time value, and we profit when they expire worthless four days later. Most of the time, using put options works best. Which put options expire worthless? The simple answer is: any put options at strike prices that are “out of the money” at the close of the market every Friday.

Here Are the Three Steps to Using This Strategy

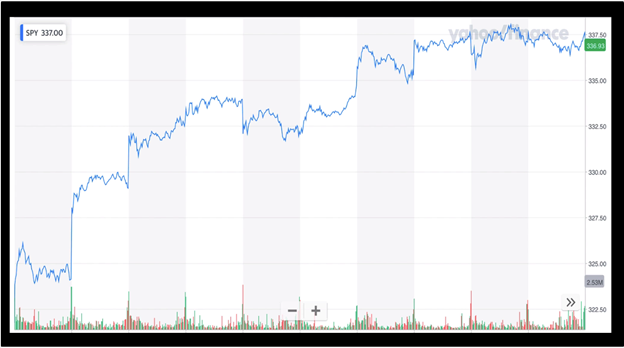
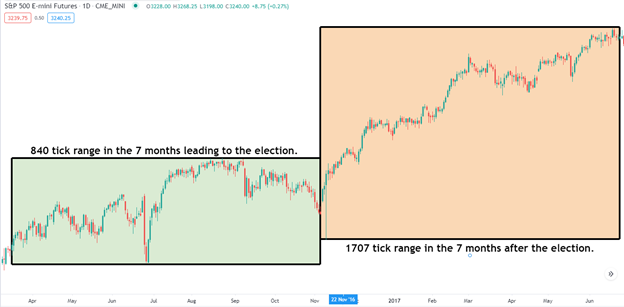
Step 1: Before you trade, you always put your fingers on the pulse of the market. The reason is because my research proves you can increase the odds of success on any trade by 85% simply by trading in the same direction as the broad market. If the broad market is even slightly bullish, you use the bull spread strategy, if it’s bearish, I use the same strategy in reverse (called the bear strategy.) I like to use the SPY for broad market direction.

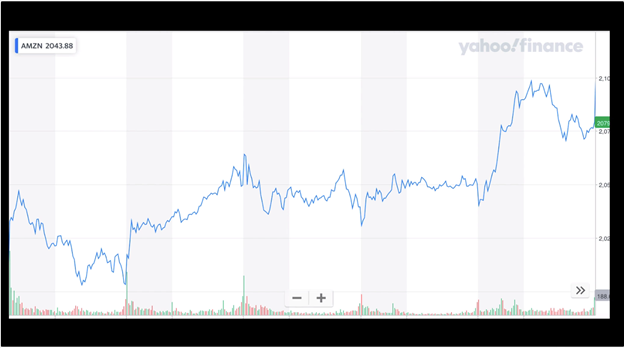
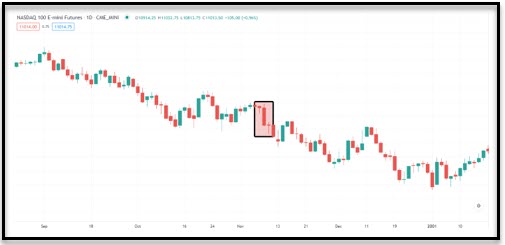
Step Two: Next, focus on the right stock, not the options. In a bullish market, you start with a stock that has available weekly options, is in an uptrend, and has a little volatility. Conversely, in a bear market, you start with a stock that is already trending down and has a little volatility. In this case, let’s look at AMZN.

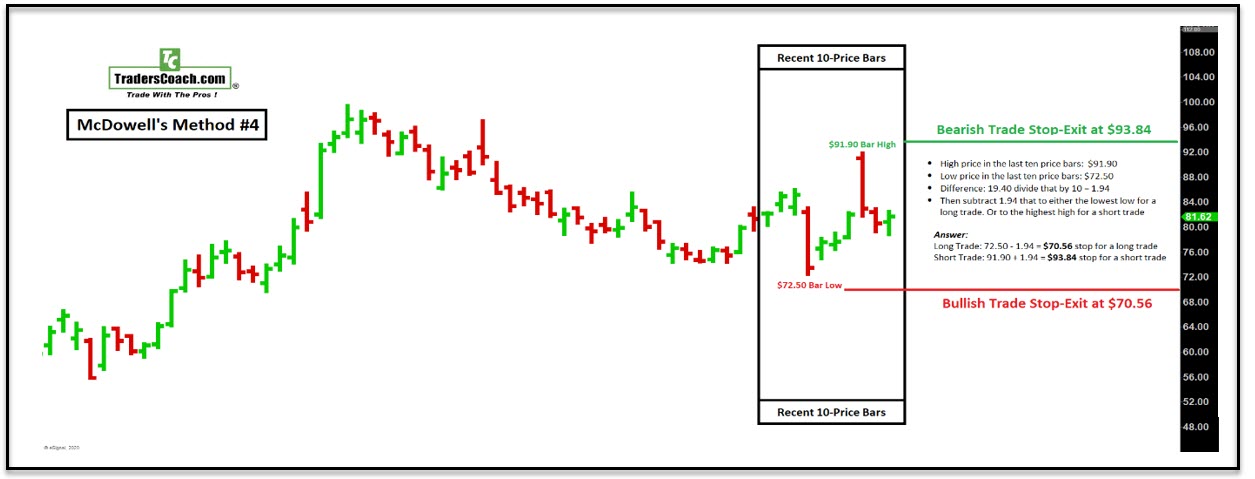
Step Three: The next step is to have an “exit strategy.” Always know how and when to get out if the trade goes bad. We can “automate” the entire exit strategy with a few conditional orders. Now you have checked the market. You have found a stock trending in the same direction and you have an exit strategy to apply after you get in the trade.

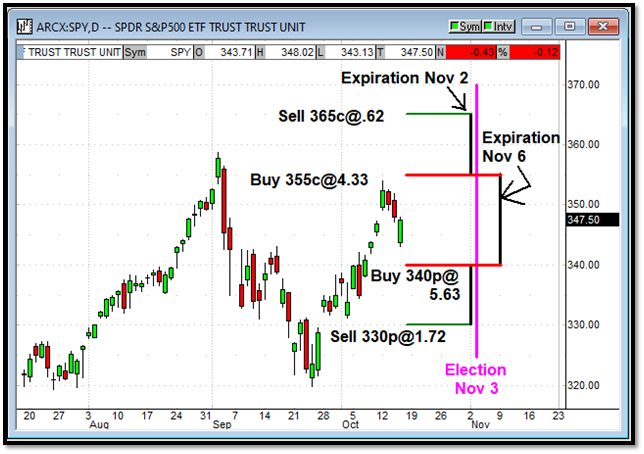
Here’s how you make money with these two options.

We sell a put and buy a lower strike-priced put. We get more for the put we sold than we spend on the lower strike-priced put that we buy, and the difference is called a net credit.

The net credit is our profit.

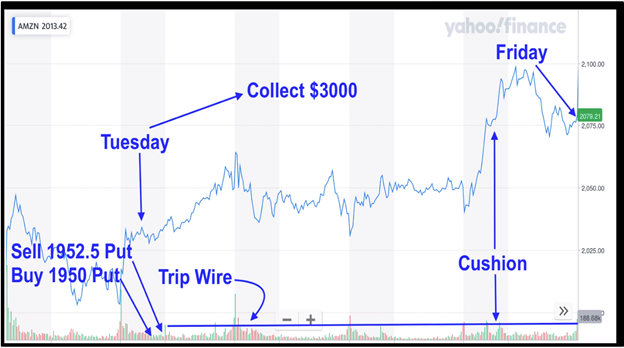
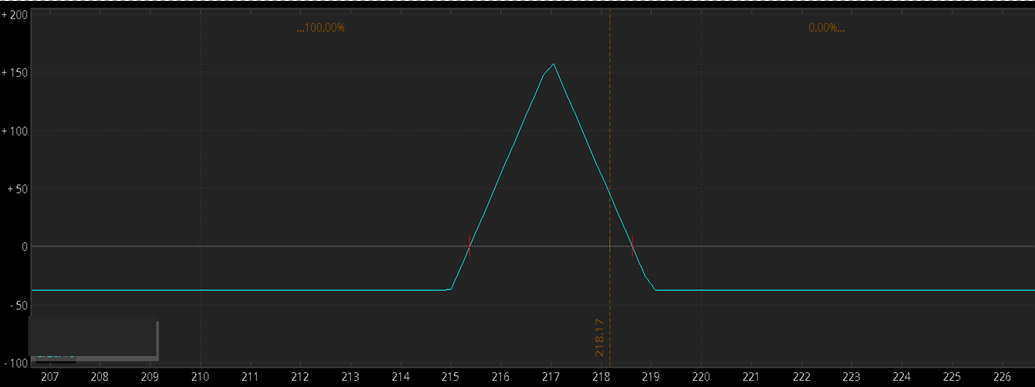
Here’s an example to help you grasp the principals and concepts. Let’s say ABC is trending higher. And let’s say it trades at $100 per share. On Tuesday, you sell the ABC weekly $90 strike-priced put and buy the ABC weekly $85 put as a hedge.

When you sell the ABC weekly $90 strike-priced put, you bring in cash. Let’s say you sold the ABC $90 put for $1.00. You sold someone the right to “put” the stock to you at $90 until Friday.  This won’t happen as long as ABC stays above $90 through Friday’s close.

At the same time you sell the ABC $90 put, you will also buy the ABC weekly $85 put as a hedge. This dramatically lowers the capital required to do the trade and limits your risk. Let’s say you spend .50 buying the ABC weekly $85 put.

OK, at this point you sold the ABC $90 put for $1.00. You bought the ABC $85 put for .50, so your net credit is .50. In this case, the difference in strike prices is $5.00, and let’s say you used 10 contracts. Your capital required is $5,000 and your credit is $500.

That’s a 10% return in one week!

In this case, ABC is at $100. If ABC stays above $90 through Friday’s close, you will make $500 or 10% for the week on this trade. If the stock goes up, you win. If the stock goes sideways, you win. If the stock goes down, you can still win. As long as it stays above $90, you win. If ABC drops below $90, you will lose some or all your net credit and some or all of your $5,000 capital required to do the trade.

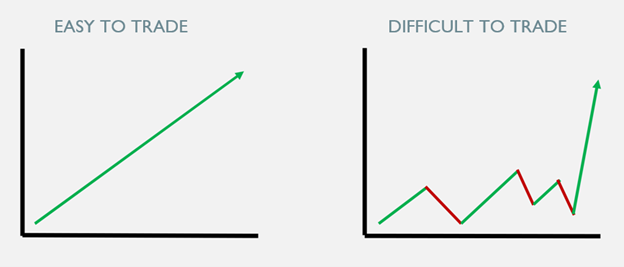
To avoid that, you can get out of this trade anytime, even before ABC drops below $90, so you have total control. The best way to avoid a loss is to use stocks that are already trending higher and going deep out of the money, below the stock’s current price, so you have some “cushion” in case the stock drops.

Quick Review: My 7 Simple Steps to Weekly Options Profits…

Step 1: Get the list of stocks that have available weekly options.

Step 2: Pick a couple of stocks you’re at least somewhat familiar with.

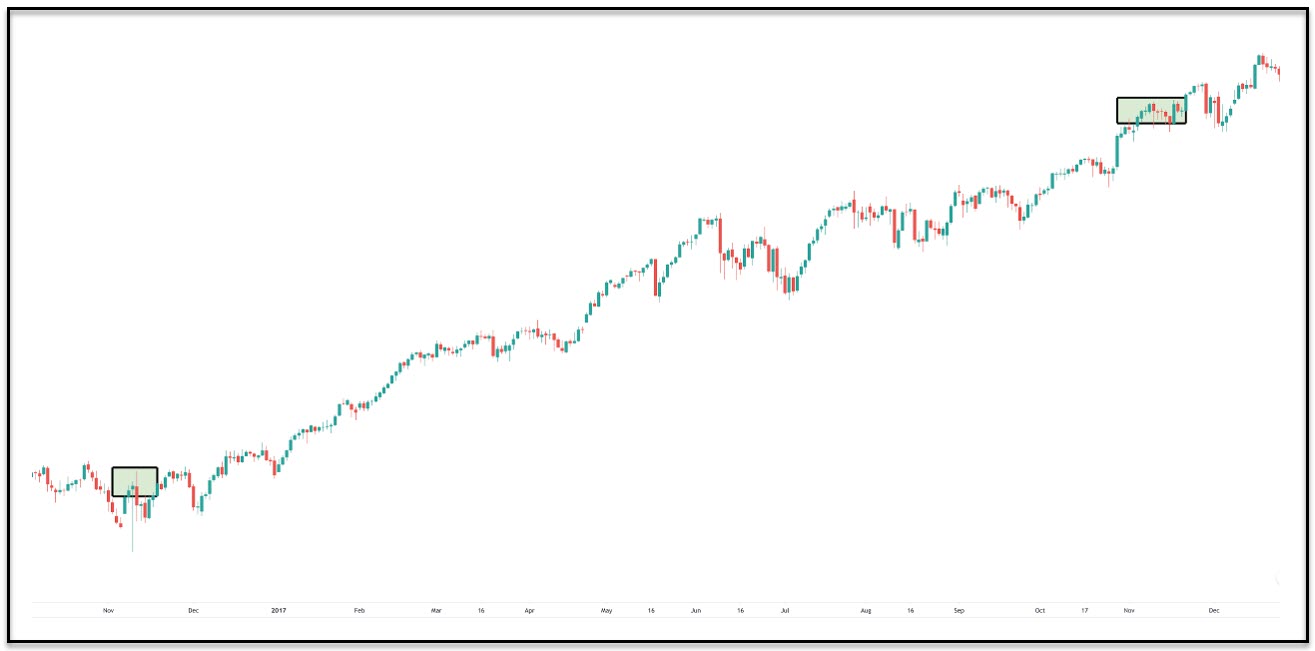
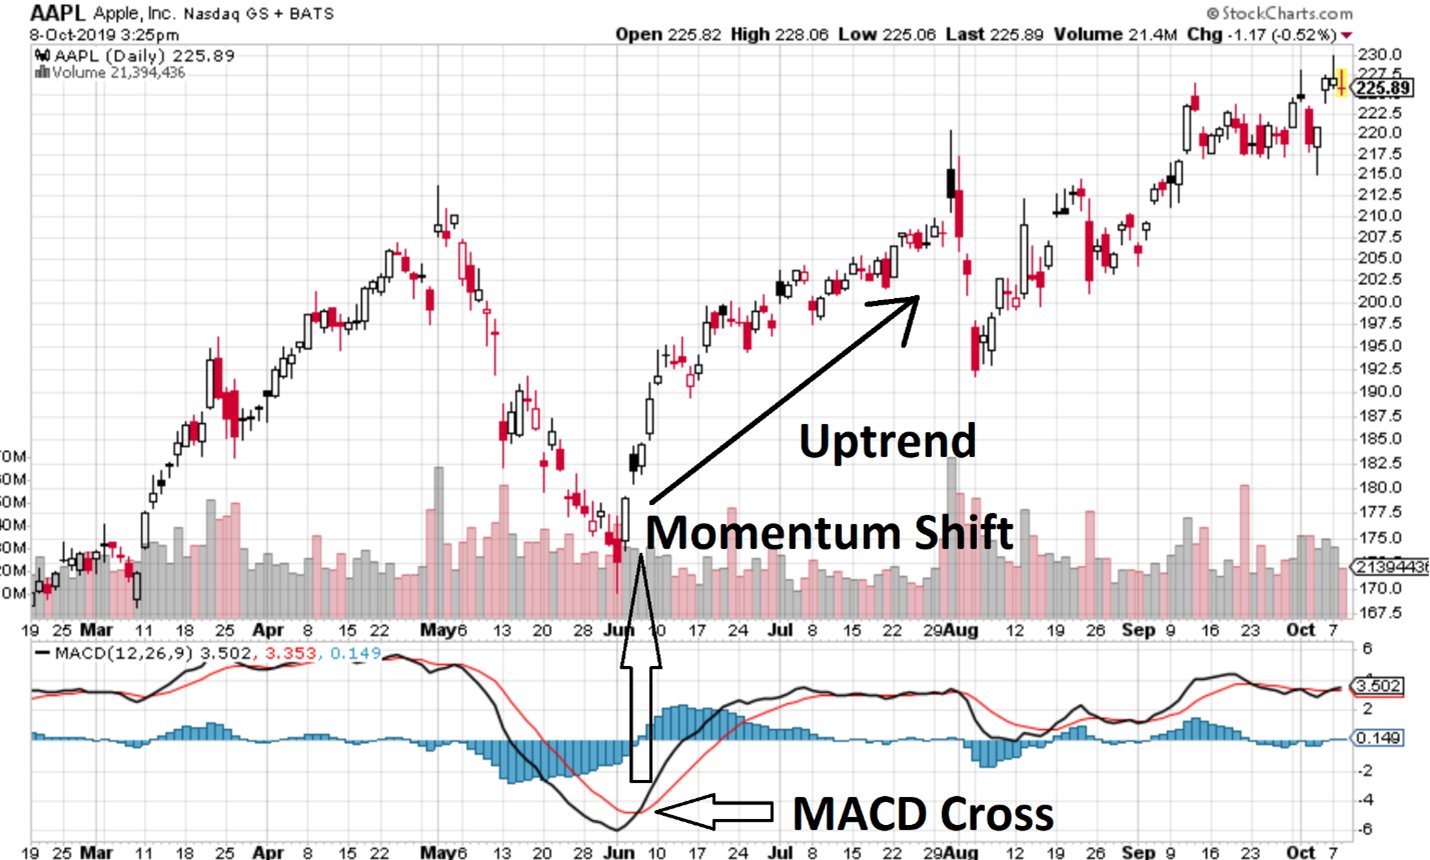
Step 3: Look at a six-month chart on each of the stocks you’ve chosen.

Step 4: After you find an appropriate stock, look at strike prices that are below the current stock’s price, at a level that the stock is not likely to hit in the next week.

Step 5: Next, go online and look at the live, weekly put options quotes. Look for a spread between two put options that have strike prices that are below the current stock’s price and support levels.

Also look for a specific difference in options prices to create a net income by getting more for the put you sold than the put you paid for. 

Step 6: Enter your order using a “limit order” and apply your exit strategy at the same time.

Step 7: Sit back, relax, and let time pass, as it always does.  One week later, both options will expire and the “net credit” you took in can be transferred into your wallet—or you can leave it in your account.  It’s up to you!

ABOUT THE AUTHOR

Author: Jack Carter
Company: Superior Information
Website: SuperiorInformation.com
Services Offered: Trading Education, Trade Alerts, Trading Workshops
Markets Covered: Stocks, Options

Chapter 12

Thursday | November 12th | 2:00 pm ET

Peter Schultz | Cashflow Heaven

Trading the Election Cycle with Confidence

  • Using the “Fearless Strangle” to trade volatile markets
  • Capture outsized profits regardless of market direction
  • How you can be wrong and still make a 30% return

Anyone who has ever traded options dreams of holding puts when that big expensive stock drops off a cliff after earnings. Or calls when a stock rockets through the roof on some sudden piece of bullish news.

The problem with buying options in real life is big announcements are often binary events—you either make a bunch of money or lose all your money.

And if you’ve got some trading experience you know that if you trade those kinds of events often enough, you are probably going to go broke.

There is just too much risk—you would have to more than double your money on the winners to make up for the total losses—and that assumes you’ll be right on direction at least 50% of the time.

That’s a tough call.

But still those gigantic post event moves just beg to be traded, don’t they?

Take the Presidential election for example—that could really create an explosion—one way or the other.

What if the election is contested?

What if there is fraud discovered?

What if one side or the other refuses to concede?

The markets hate uncertainty—so any of those outcomes could create a crash.

On the other hand, if the election goes smoothly and traders believe another huge round of stimulus is coming, stocks could go through the roof.

The most common options strategy for trading known high-volatility events is to buy a straddle or strangle—calls and puts on both sides of the underlying.

Sure, you are covered both ways—but the cost of such a trade is high because you are buying options in either direction during a period of known high volatility—so those options will be expensive.

That means the underlying has to move far enough to cover the cost of both sides—and that’s a tall order. Anyone who has traded strangles and straddles can tell you it’s easy to lose as often the big event isn’t quite as explosive as imagined.

So, what’s the solution?

The key is to reduce the cost of the trade while putting three powerful aspects of options in your favor—greatly increasing your probability of profit.

For this strategy we’re putting three powerful greeks on our side--Theta, Delta and Vega.

Here how…

We’re going to buy a strangle to make money on any post event move—up or down—and sell a strangle to offset our cost.  But here’s the trick--our sold strangle will expire just before the event leaving a reduced cost full open strangle to really rack up the profits on a big move.

And if one side or the other gets overrun before the event—well—we’ll make money on that too.

This wonderful trade is made possible by certain underlyings having expirations three times a week. In this case, we’ll be trading the SPY—the SP-500 ETF.

The SPY is a beautiful thing for options traders—it has super narrow bid/ask spreads so it’s really efficient, it has narrow strike prices so you can pick exactly what you want to buy or sell, and it has expirations Monday, Wednesday and Friday—which is pretty convenient if you want to slot your big event right between two expirations.

I know these complex strategies are a little tough to understand using just words—so let’s take a look at a picture:

As you can see, we are buying a put and a call just 7.50 away from the underlying which closed at 347.50. These bought options expire AFTER the election on Friday November 6.

And to offset our costs we’re selling a put and a call at strikes ten points beyond our bought options that expire BEFORE the election on November 2.

Since our bought options expire after our sold options we’re benefiting from theta (time decay) as the time value of what we sold is decaying faster than the time value of what we bought.

And as we know one of the best ways to give yourself an edge trading options is to put time decay on your side.

But we also have the delta on our side. The reason is as the underlying moves toward one side or the other our bought options are appreciating faster than our sold options because they are closer to the money.

That puts the delta on our side.

So now we have two of the biggest, toughest greeks to ever haunt an options algorithm on our side.

That’s a nice two edge advantage—but we have one more—Vega.

Volatility affects Vega, and our sold options expire BEFORE the big volatility event—and our bought options expire AFTER it. The closer we get to the event the more that Vega will be priced into the options giving us a further edge on our bought options. But if we take our position two or three weeks before the event the Vega won’t be quite so pronounced—so that gives us a third edge.

So, with this set-up let’s take a look at our possible outcomes.

First our best-case scenario is for our sold options (green line) to expire out of the money on November 2 leaving two relatively cheap bought options with unlimited profit potential on a big post-election move.

Our next possibility is a big move before the election on say—a stimulus package being announced. If the underlying shoots through one of our spreads then we simply close it for about the distance between the spreads—which is ten dollars.

Keep in mind our cost basis is less than ten dollars—so in that scenario we would make money.

If you add up our cost basis from top to bottom on the chart above it comes to—+.62-4.33-5.63+1.72= 7.62.

If our cost basis is 7.62 and we close the top or bottom spread for around 10.00 that equals a 2.38 profit—or 31%

Plus, we’ve got the other side for free—and in a high-volatility market that could mean something.

And our third scenario is the SPX decides to not go anywhere and just trades sideways between 340 and 355—all the way past the election to November 6.

If that were to happen we would lose money—but do you think that’s what is going to happen based on what the SPY has already done in the past few weeks?

I mean look at the chart—if we would have done this a month ago we would have made a fortune on the put side. And if we would have done it two months ago we would have made a fortune on the put side AND the call side!

And that was WITHOUT a hotly contested Presidential election.

A likely scenario for this trade is an expiration of both our sold strikes by November 2 leaving us with a bought side that is in the money or close to it AND the possibility of a huge move post-election.

That sounds like a nice place to be—so that’s what we’re going to do.

But we’ll see—the markets are nothing if not unpredictable—but on the other hand, that’s exactly what this trade is designed for.

In fact this strategy is so effective at trading volatility without having to worry so much that we call it ‘The Fearless Strangle’.

It’s designed to turn unpredictability into profits--fearless profits.

ABOUT THE AUTHOR

Author: Peter Schultz, Founder
Company: Cashflow Heaven Publishing
Website: CashflowHeavenPublishing.com
Services Offered: Trading Courses, Coaching, Weekly Advisory Newsletter
Markets Covered: Stocks, Options

Chapter 13

Thursday | November 12th | 3:00 pm ET

Bennett McDowell | Traders Coach

Magic Bullet for Trading Election Volatility

  • Why volatility happens and how to profit from it
  • Pro strategy for sizing up high probability entries
  • Creating stop-loss exits that breathe with the market

During certain market conditions, volatility can be extreme. Sometimes it can be triggered by a major world or economic event.

Examples of highly volatile market cycles and their triggers include:

  1. Terrorist Attacks – Example: Nine-Eleven, 9/11/2001
  2. War – Example: Pearl Harbor, 12/7/1941
  3. Global Medical Crisis – Example: COVID-19, 3/9/2020
  4. Elections – Examples: Brexit, 6/24/2016; and Trump vs Clinton 11/8/2016
  5. Financial Market Crashes – Examples: Depression, 1929 and Recession 2008

These 5-Events Created “Uncertainty” & That Creates “Volatility”

Typically, financial markets do not like “uncertainty” and they respond with extreme volatility.  Once “certainty” is restored, the markets will return to business as usual.

Volatility is a measure of price-change during a specified amount of time. When markets are volatile, this means that prices are changing fast in a short period of time.

On the other hand, non-volatile markets refer to markets where prices change very slowly and in an orderly unchaotic fashion or remain totally unchanged.

Extreme Volatility can be seen on a price chart in the following ways:

  1. Price Gap Up or Down
  2. Elongated Price Bars
  3. Sudden Volume Surge
  4. Extreme Price Movement

If you have traded long enough, sooner or later you will experience the effects of sudden unexpected volatility. 

When caught off guard a trader can get “whip-sawed” …which is when you repeatedly get stopped out of trades too soon.

When this happens, it is because your stops were not compensating for the volatility and were too close or too tight.  You may have been correct on the direction of the market, but your stops took you out before you could lock in profit.

The good news is that once prepared for it, volatility can be your best friend and can deliver the biggest profits in the shortest amount of time. 

You can do this by using simple strategies and formulas, one of which is presented here for you.

“Volatility Exit Strategy”

Here is a strategy to combat high volatility and make it your friend.

GOAL: manually calculate your stop-loss using the following formula.

Can be used for initial and trailing stop exits.

This method is quick & easy and recommended for day traders as well as position traders.

Steps:

  1. Visually look at the price bars, if the current price bar is larger than the previous one, then volatility is increasing.
  2. Subtract the lowest price from the highest price within the last ten price bars
  3. Divide that by ten.
  4. LONG TRADE: Subtract that from the lowest low for a long trade.
  5. SHORT TRADE: Add that to the highest high for a short trade.

Chart Example: “Volatility Exit Strategy”

Example: 

  • Highest High Price in the last ten price bars:  $91.90
  • Lowest Low Price in the last ten price bars: $72.50
  • Difference: 19.40
  • Divide difference by 10 = 1.94
  • BULLISH LONG-BUY TRADE STOP EXIT: Subtract 1.94 from the lowest low for a long trade.
  • BEARISH SHORT-SELL TRADE STOP EXIT: Add 1.94 to the highest high for a short trade.

 Solution:

         Long/Buy Trade: 72.50 - 1.94 = $70.56 stop for a long trade

         Short/Sell Trade: 91.90 + 1.94 = $93.84 stop for a short trade

Conclusion:

Your trading rules are your edge so adhere to them. They give you structure amid chaos.

During periods of "High Volatility", do not throw your rules out the window …

Instead, recognize that panic triggers irrational moves and that you need to adapt or die.

Ironically, periods of high market volatility offer the greatest opportunity for profit … only to the traders that know how to harness the energy of volatility.

Typically, traders that possess this skill are few and far between. 

But, when prepared for volatility … you can become one of these rare traders and you can seize the opportunity to benefit and profit from volatility. 

ABOUT THE AUTHOR

Author: Bennett McDowell
Company: Traders Coach
Website: TradersCoach.com
Services Offered: Trading Education, Software, Trading Community
Markets Covered: Stocks, Options, Futures

Chapter 14

Thursday | November 12th | 4:00 pm ET

Stephen Bigalow | Candlestick Forum

Profit from Election Using Candlestick Patterns

  • How candlestick analysis shows impact of major events
  • Which sectors and stocks to watch if Biden wins
  • Will a Trump win have a bullish impact on general market

Elections have consequences! From your political point of view, you may have been exalted or greatly disappointed. From your investment point of view, you would be very pleased if you used candlestick analysis. Candlestick analysis identifies the consequences. You would have discovered which stocks and sectors were going to benefit if Biden wins or Trump wins?  The graphics of candlestick signals and patterns illustrate very pinpointed information. They are the result of actual decisions, not estimates, not conjectures, not projections. Utilizing that information, there is a double polling process. First, specific stocks/sectors will show bullish or bearish indications based upon the expected results will be if a specific candidate wins. This will be reflected in the policies promoted by each candidate. Secondly, the magnitude of those sector movements was likely to indicate which candidate the investment community expected to win the election.

Campaign promises, oriented toward specific sectors, acted well based upon the expectation of sectors receiving beneficial legislation and funding from the next administration. A Biden win would benefit sectors that he was advocating in his  campaign promises. The Biden/Harris team has indicated a general easing of cannabis  restrictions on a national basis. Obviously, this would instigate investor sentiment becoming bullish in those stocks. This was demonstrated with strong bullish candlestick patterns that developed in the stocks in that sector. CGC had produced a scoop pattern. The scoop pattern produces a very strong bullish price move potential. It had moved up substantially and   processed in forming a J-hook pattern, indicating more upside. TLRY produced a bobble breakout, another high probability high profit trade set up.

A major benefit of candlestick analysis – knowing where to look for the best possible trades. If it is assumed a Biden win would be beneficial to the cannabis industry, the candlestick investor has the advantage of producing simple scanning techniques to find which stocks may be producing the best chart patterns/bullish potential. Recognizing price patterns that indicate investor sentiment enhances the probability and the profitability of participating in the chart patterns.

The green energy related stocks, solar energy and wind energy, would have been assumed to be gaining positive prospects under a Biden/Harris ticket potential win. The graphics of candlestick charts allow for identifying which specific sectors was getting an overall bullish perspective. The simple scanning techniques it can be utilized to find the strongest/most bullish pattern set ups.

One of the keys to successful trading is being able to pinpoint strong bullish or bearish sentiment. You can enhance your correct trade ratio by knowing what candlestick charts are revealing about current events i.e. elections.


Additional sectors, such as electric vehicles and China related stocks, were perceived as benefiting from a Biden win. The advantage for the candlestick investor is utilizing the simple candlestick scanning techniques to investigate which stocks in specific sectors have the strongest signals and patterns. This produces the best prospects for profitable trades.

The direction and magnitude specific sectors were influenced by a particular candidates probabilities of winning. If the prospects of a candidate’s probabilities of winning were altered, by changes in polling results, the bullish sentiment of stocks in a bullish sector would start showing evidence of weakness. This will be illustrated by candlestick reversal signals. Profits could be made after an election by going short.

A Trump win? The prognosis of which sectors may be the most influenced was much more harder to discern. The overall market trend had been a major indicator during his first term. Because the general market has moved in an uptrend over the past four years, there may not be specific sectors that will show any more bullish trending than what has already been in progress. As illustrated in the candlestick analysis of the overall market trend, the fluctuation of the markets were based upon the probabilities of his winning or losing.

Sideways trending mode of the market indexes reflected the lack of identification of who may be the winner of the election. Polls appeared to be favoring Biden. Enthusiasm appears in a correct and okay you go get your deal will him to be favoring Trump. The lack of consensus has put the markets in a sideways mode or the sideways mode of the market reveals there is a lack of consensus.

Fortunately for candlestick investors, the perceived strength or weakness in specific sectors may have been able to which candidate is going to win, and it allowed for investing in sectors that are showing signals/patterns that can be easily identified as benefiting from new policies. Prices move based upon investor perceptions. Candlestick charts reveal those investor perceptions. Even when a candidate did not win, profits can still be made after the election. Bullish price moves that had moved up strong before the election would show candlestick sell signals, indicating short positions could be placed. If expected election results did not occur, an uptrending stock/sector would  turn into a good short position. The strength of the reversal would be identified by the strength of a candlestick sell signal.

The candlestick charts expand your trading insights. They illustrate what investor sentiment is projecting as an expected result. Whether right or wrong about an election result, the candlestick charts will visually produce profitable trade set ups. This would be the same scenario as an up-trending stock anticipating strong earnings, selling off hard if the earnings turn out to be opposite of what was expected. When utilizing candlestick charts, you gain a huge advantage for graphically witnessing what investor perspectives have resulted after a certain result. You gain a valuable advantage when utilizing the information built into candlestick signals.

ABOUT THE AUTHOR

Author: Stephen Bigalow
Company: Candlestick Forum
WebsiteCandestickForum.com
Services Offered: Trading Education, Books, Videos, Webinars, Indicators, Live Trading Room
Markets Covered: Options, Stocks, Forex, Futures

Chapter 15

Thursday | November 12th | 5:00 pm ET

Michael Nauss | Trade-Ideas

Trading & Investing in Volatile Markets

  • Elections, earnings, and key news events rile the markets
  • Tools I use to day trade, swing trade, and invest with
  • How to use these tools regardless of market or time frame

Most traders and investors are familiar with the concept of earnings season: the period of time when most public companies release their earnings and other fundamental financial metrics (price/earnings, cash flow, debt, etc) required by the SEC. These company announcements very often trigger moves in the stock price and establishes a new equilibrium. The volatility around this response is often strong and is the focus for many trading strategies. As I often say, ”I don’t attempt to trade the news but I trade the market’s reaction to the news.”

Most traders think about earnings season in an inaccurate way. This chapter explains why that is and suggests a much better way to think about earnings seasons.

Why “SEASON” makes no sense

The word "season" implies that there is a definite start and end date. Like deer season, you have a start date where it is legal to shoot deer up until the end date of the season after which it becomes illegal to shoot deer again.  Everyone knows the well-defined dates of the season and almost everyone adheres to these rules.

This is not the case with earnings releases. You can find companies reporting earnings on every trading day of the year.

There is also general disagreement about when earnings season starts and ends. Traditionally, it was thought that earnings season officially kicks off with the earnings release from one company: Alcoa (AA). Over the years, as technology companies have become increasingly more important, this tradition seems to be fading.

I've noticed that traders often speak as if they are intimately familiar with earnings season, but if you ask them to put the earnings start and end dates on a calendar, you'll end up with a variety of different dates.

A Better Way to Think About Earnings

Here's how I've come to think about earnings season over the course of over a decade of trading.

First, when you look at the distribution of when companies report earnings, you will see a clustering around certain times of the year. However, you will also notice a lot of companies that report outside of those clusters, as shown in the chart below.

Notice how the length of time varies between each earniings season. Why is that? Most companies have fiscal years that are aligned with the calendar year. These companies are reporting earnings for an entire year starting in mid January. It takes longer to report annual earnings than quarterly earnings since you’re producing fancy, glossy reports and fulfilling additional requirements.

So, what date makes sense to use as the start of a particular earnings season given the fact that there are companies reporting every trading day? Enough traders still respect the Alcoa earnings report as the start of the season to follow along. When you plot those dates on the chart it does seem to align pretty well with what most would consider the start of the earnings seasons. Until some other method comes into vogue this seems logical.

What about the end date for each season? You can’t simply add a certain amount of days to each start date since the season length varies so much. A better way to think about it is for a given day calculate a percent of the way through that particular earnings season. In other words, of the total number of companies reporting that season, what percent have reported as of a particular date?

Chart Showing the Earnings Big Picture

The above chart is shows the 2020 earnings season. As of this writing it shows February 11th and that we’re 33.1% through the current earnings season. You could use this chart to determine when it’s best to take time away from the market. Because the earnings seasons have different lengths, this visualization is a much better way to think about earnings.

Now that we've used a better way to determine where we are within earnings season, let's look at the best way to scan for individual companies that have reported recently or in the near future. There are a few different tools for this purpose, but during my presentation on Thursday November 12 at 5:00pm ET I will focus on comparing and contrasting Yahoo! Finance Earnings Calendar and the Trade-Ideas Earnings Scanner

Having a thoughtful plan to navigate earnings season, short term investing and trading can be surgical and precise vs. aimlessly looking or waiting for opportunity. When technology improves routines and identifies ways to save time and improve results, the gains are obvious.

ABOUT THE AUTHOR

Authors: Michael Nauss
Company: Trade Ideas LLC
Website: Trade-Ideas.com
Services Offered: Live Streaming Trading Ideas Powered by Artificial Intelligence
Markets Covered: U.S. and Canadian Equities