WestmarkTrading - High Probability Setups - Strategies Built for Consistency

HOW TO GET THE MOST OUT OF THIS EBOOK

Thank you for accessing the eBook- High Probability Setups - Strategies Built for Consistency. This eBook is designed for beginning, intermediate and advanced traders and investors. The authors in this eBook are leading experts in evaluating opportunities in stocks, options, futures and Forex markets.

As you read this eBook and view the videos, you will be exposed to strategies and techniques that are designed to help you become more confident and consistent in your trading and investing activities. It is our sincere hope that after reading this eBook, you will take away a few actionable strategies that can help you achieve better trading consistency.

Many of the chapters in this eBook are divided into two sections:

“The Game Plan” – An introduction to a strategy and technique that may be enhanced with illustrations and examples.

“The Special Offer” – If you like the strategies and techniques being discussed, this is where you can get more information on the author and services they offer.

Some of the things you will learn in this eBook include:

At WestmarkTrading.com  it is our sincere hope that you take away several ideas that you can use when you are done reading this eBook. You may also learn about markets that you currently don’t follow, and you will find out if they are suited to your trading and investing personality.

Finally, make sure to subscribe to WestmarkTrading.com.

We provide free eBooks, videos, reports and other publications for active traders. Cheers to your trading success!

Chapter
01

How To Generate Triple Digit Gains With Growth and Tech Stocks!

By Roger Scott, WealthPress

One of the most interesting things that I’ve learned since I began trading over two decades ago has very little do with the mechanics of trading.

It’s all about the human mind and, more importantly, human behavior.

There’s something about human nature that’s truly remarkable…

When it comes to making consistent profits from the financial markets, the majority of people are far and away their own worst enemy!

I find that the great majority of retail traders get in their own way.

They make things much more complicated than they have to be.

The result? Self-sabotage.

Ultimately ruining the possibility of achieving consistent profitability over time.

Retail Traders Utilize Trading Tools That Were Created before the First Man Landed on the Moon…and Expect Them to Compete with Multi-billion dollar Hedge Funds!

The first big mistake is using indicators that were specifically designed and created to work with the commodity market (woops).

Unfortunately, commodity markets don’t work like stocks, options and ETFs.

In fact, commodities, currencies and futures are predominantly trending markets.

Stocks are counter trend markets.

Indicators that work well with trending markets are not nearly as effective with counter trend markets.

That’s like using a ruler that measures inches to determine centimeters… it just won’t work.

To complicate the problem even further, the great majority of technical indicators are lagging indicators that reflect what already occurred in the past.

What does that mean?

It means that you are relying on something that happened in the past to help you gauge future price movement.

That’s equivalent to driving your car while looking at the rear view mirror. You’re MUCH more likely to crash than reach your destination!

Take the moving average indicator - the most popular technical indicator of all time.

It was created in the late sixties to help gauge trends in commodity markets.

In the 60’s and 70’s, commodities trended sharply and the moving average was extremely effective.

But the moving average was never intended or designed with stocks or any type of equities markets in mind.

And neither were dozens of other technical indicators that came preloaded with your online stock broker software.

If you think about it logically, you will realize that the great majority of technical indicators were created over 40 years ago.

Have you seen stock market action in the 60’s and 70’s?

Before hedge funds dominated the stock market in the late 80’s and early 90’s, most stocks barely moved.

In fact, the average daily range for most stocks at that time was less than $.25

Speculative trading was strictly limited to the commodities, currencies and futures markets.

But over 40 years later, millions of traders use the exact same indicators to gauge price movement in equities – with very little success!

Fortunately, there’s a very simple way to gauge stocks, options and ETFs.

And, it doesn’t involve outdated indicators that were created for an entirely different set of markets, over 40 years ago.

Relative Strength or Comparative Strength Analysis Tells You Exactly What Stocks Are Being Purchased By the Largest and Most Aggressive Funds in the World!

Over the past 20 years, large hedge funds have come to dominate the stock market.

Think about it: it takes massive amounts of volume to move large cap stocks like Google, Tesla and Amazon.

Only the biggest funds have the buying power to accumulate millions of shares continuously over several days or weeks at a time!

Institutional money continuously rotates into the strongest stocks and out of weaker stocks.

As a stock gains strength, more funds flow into it and out of weaker ones.

That’s how the biggest growth stocks on the planet move higher.

That’s how the biggest stocks in the world double and triple in price.

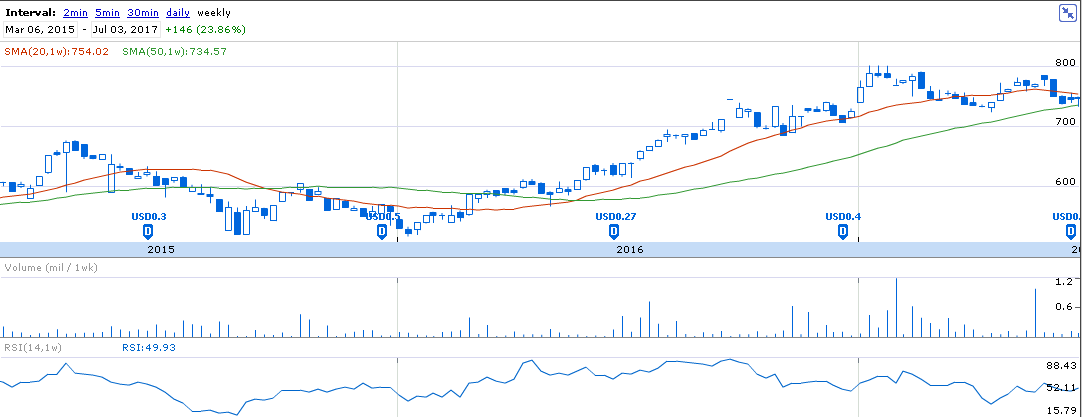
Comparing the Percentage Increase in Value of One Stock to another Stock Is Called Relative Strength Analysis

The example below is a simple demonstration of comparing 4 different stocks over a 2 month time period.

The odds are strong that stock D will continue to outperform all other stocks.

If relative strength continues to rise, institutional traders will continue piling in.

This type of analysis is much more powerful and effective than relying on indicators.

You have to remind yourself, indicators are derived from price action that reflect what already happened in the past.

Unfortunately, there’s no forecasting value in “what already happened in the past”.

If you want to see which horse is the fastest you compare it against all other horses in the race.

That’s the approach that Multi-Billion dollar hedge funds utilize to buy stocks and sell stocks.

I typically analyze relative strength on a 2 month, 4 month and 6 month time frame.

Focusing on the biggest growth stocks… ones that are part of the NASDAQ 100.

These stocks have strong institutional sponsorship and liquidity.

Most importantly, they hold the potential for massive price appreciation.

This is how multi-billion dollar hedge funds decide which stocks to trade.

Comparing Current Volatility to Past Volatility Is One of the Best Ways to Determine If Stocks Will Continue Trending or Will Become Choppy!

I’m going to let you in on a little secret...

Institutional traders have known this for years!

Volatility… when compared to past price movement can give us a very strong indication of future price movement.

Let me show you by way of example.

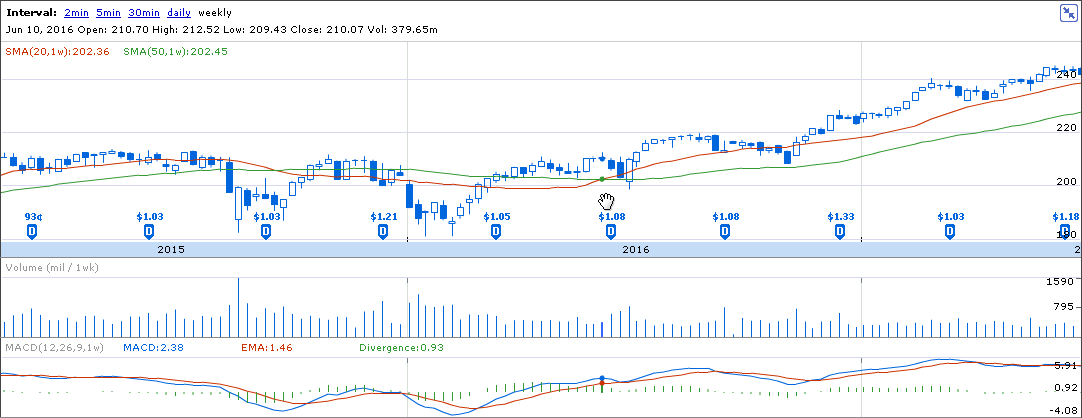
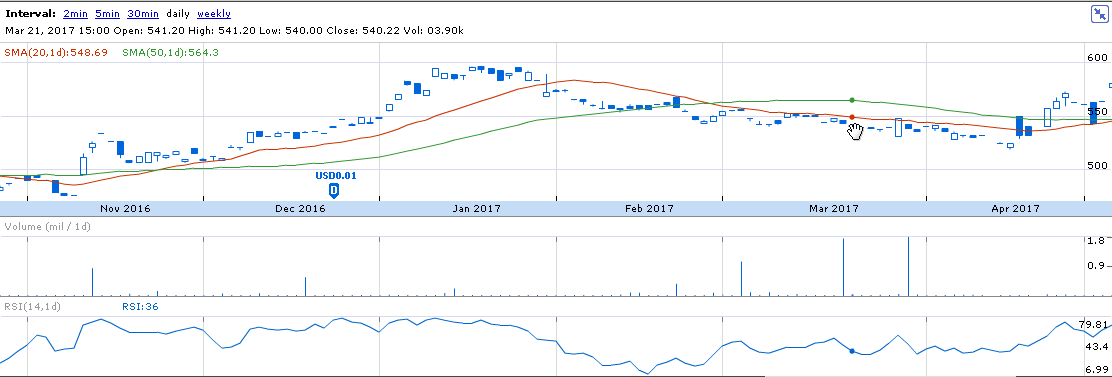
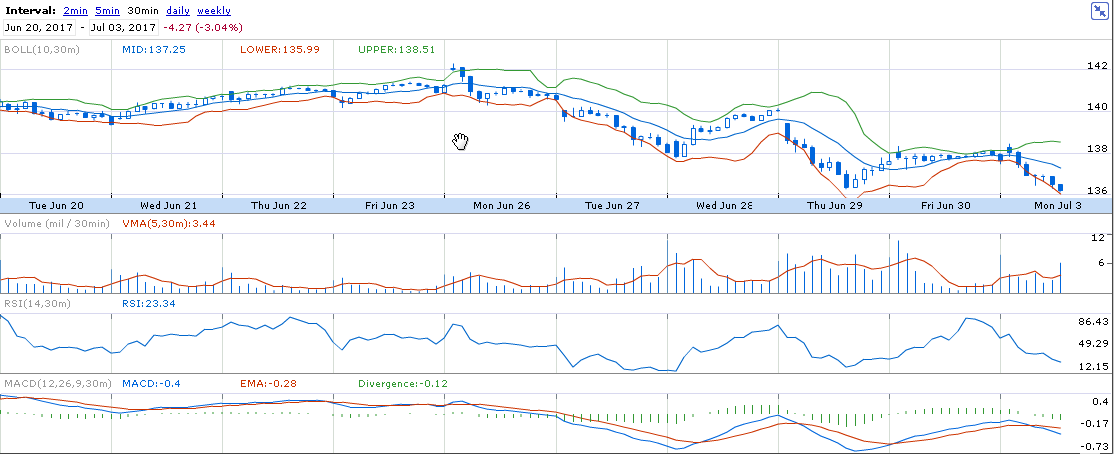
Take a look at the Amazon chart below.

Notice that during the entire period of time, the level of daily volatility is fairly constant.

In other words, the day to day price fluctuations are even.

Why is this so relevant?

When volatility levels remain stable the odds of seeing further price appreciation is highly likely.

If volatility increases or spikes, it usually means there’s a shift or a change of balance between buyers and sellers.

It means that the stock or ETF will begin stagnating and possibly even turn around and begin trading lower.

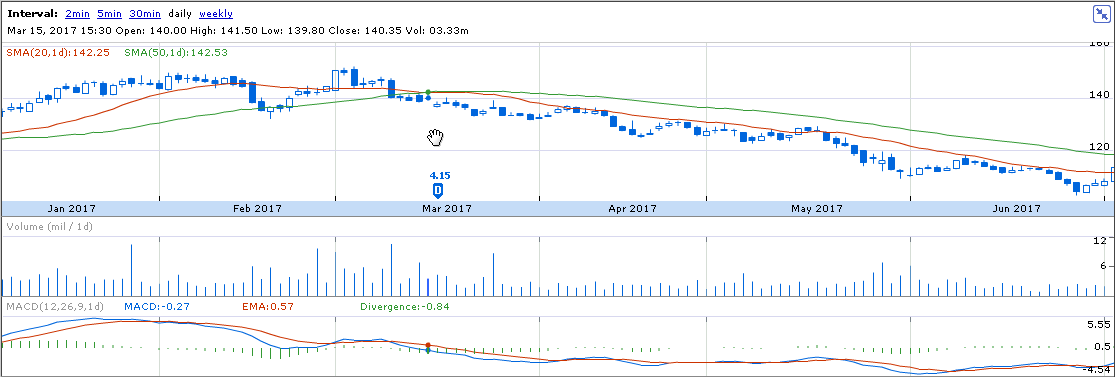
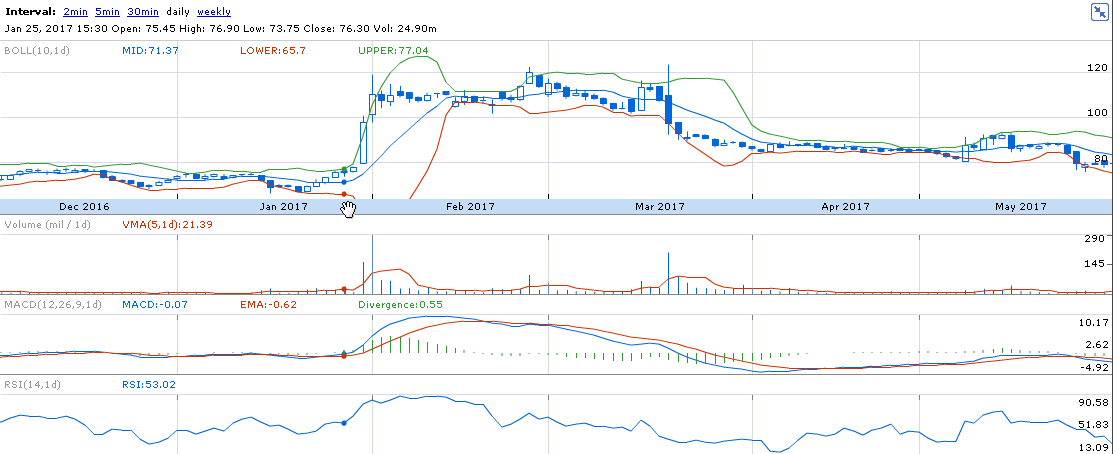
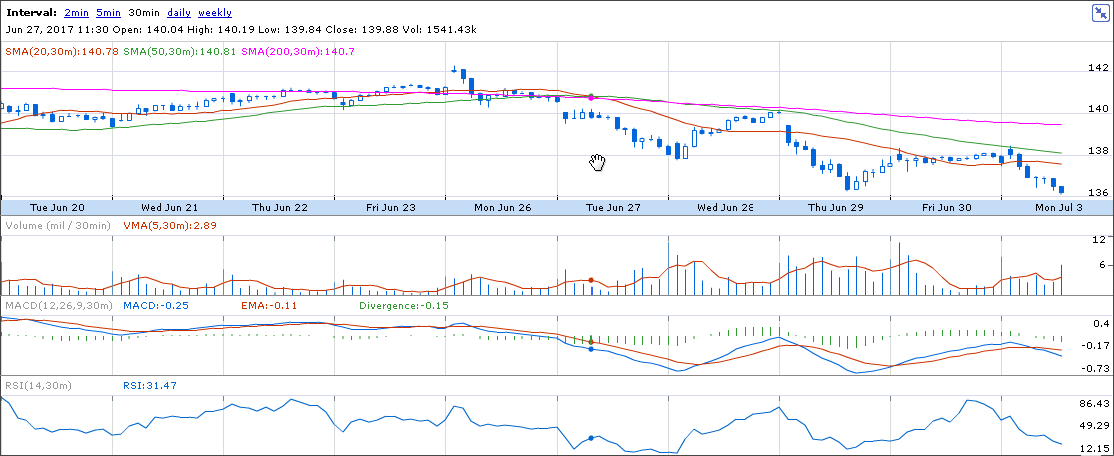
The QQQ ETF example that you see below is a good example of a major spike in volatility.

The trading range is roughly 3 to 4 times the average daily range over the past 2 months.

When volatility spikes, especially after a significant trending period, it means the stock or ETF is getting ready to stagnate or begin trading lower.

Change in volatility is one of the most significant factors that determines whether or not the trend will come to an end.

Unfortunately, change in volatility is something that most retail traders completely ignore.  

Adding This One Single Asset to Your Portfolio Can Aggressively Increase Profits and Reduce The Number of Losing Trades!

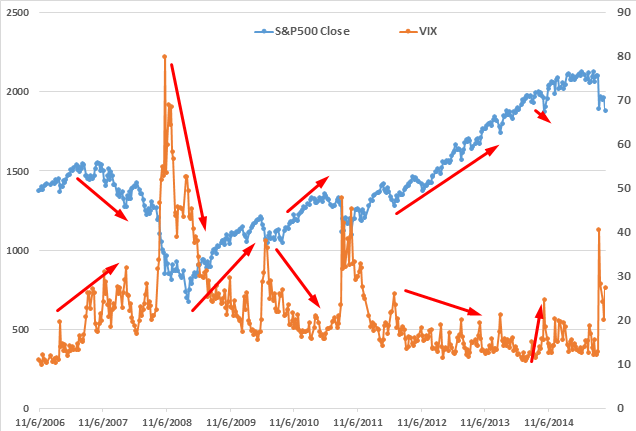
Take a look at the two charts below… notice how one goes straight down while the other one goes straight up.

To give you a better understanding… the chart on the left is the chart of the stock market during the worst part of 2008.

The chart on the right is the long bond during the exact same period of time.

When the stock market trades lower, the bond market trades higher.

This is called “flight to quality” and when stocks trade lower, investors shift or rotate out of stocks and into bonds.

This happens because bonds are considered safer than stocks by a majority of investors. 

If you look at any major stock market correction, you will see that bonds trade higher when stocks trade lower--it’s that simple.

Why is this important?

Because trading the long bond is how just about every large multi-billion dollar hedge fund offsets risk instead of relying on stop loss orders.

This can cause your position to be stopped out prematurely, before the big move occurs!

And if there’s anything worse than being stopped out of a stock…it’s getting stopped out before the stock begins to trade higher.

You’ll take a loss and miss out on profit potential too… it’s a double whammy!

In the past, before ETFs were created, traders had to go to the futures market and trade the 30 year long bond or the 10 year Treasury note.

Unfortunately, this required understanding of the futures markets and required a hefty margin.

Now, traders don’t have to worry about learning how to trade futures, understanding contract expirations or having to trade large sized account.

Over the past 10 years, hundreds of different ETFs were created specifically to avoid futures contracts.

In short, there are several assets, such as the TLT or the EDV or even the leveraged TMF, which track the performance of the long bond almost tick for tick.

Giving the retail trader the advantage of having the long bond in their portfolio, without the downside of having to trade large futures contracts instead.

If you still don’t believe me, just see for yourself.

On the left side is the long bond ETF which trades exactly like a stock.

There’s no contract roll overs and you can buy as little as 1 share or 50,000 shares.

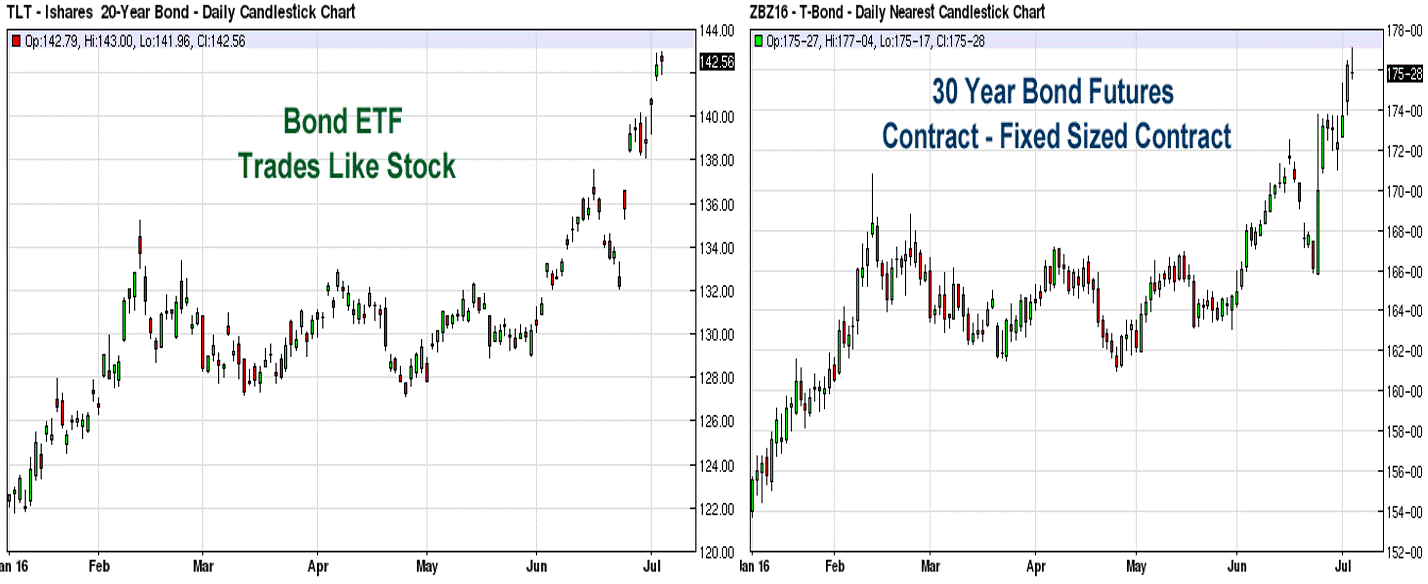
The chart to the right is the actual 30 year long bond futures contract during the same exact time period.

The 30 year is a fixed sized contract that professional hedge fund managers utilized for decades to offset risk while holding stocks instead of relying on stop loss orders.

Let’s Put Everything Together

To summarize:

  • The great majority of technical indicators were never created or designed or tested with stocks in mind.
  • Most indicators are lagging indicators that reflect what already happened in the past and do not work effectively with counter trend markets such as the stock market.
  • Applying lagging indicators to the stock market is equivalent to driving your car while looking at the rear-view mirror.
  • Relative strength follows the strongest stocks in favor of weaker stocks, giving traders the best possible indication of what stock is going to continue moving higher in the near term.
  • Comparing volatility levels to past volatility levels can tell you if the stock is going to continue trading higher or stagnate without using fancy indicators or advanced technical trading tools.
  • Three decades of back testing thousands of different stocks and commodities demonstrates that sharp increase in volatility levels will causes most financial assets to lose their directional movement.
  • Finally, using the long bond to hedge against downside risk can drastically increase the percentage of winning trades. It can also decrease the overall risk and volatility level to your trading account and eliminates the need for stop losses which often cause more harm than good.

If you have been paying attention, the summary above should change your life. It’s a glimpse into how you should be trading if you’re serious about making strong returns in the market.

Armed with the info I have given you, you can begin to build a successful approach to trading. You have everything you need to get to the next level.

But I want to go a step further…

I have created a powerful presentation that expands on every step we’ve talked about in this chapter. It’s a deep dive into how to perfect the approach we discussed today.

In fact, the training is over 2 hours long. I don’t hold anything back!

I will be teaching the exact strategy that, with my rules, has generated a 26,654.82% return over the last 6 years…

It almost sounds too good to be true. And that’s why I will show you all the details and the proof in this powerful strategy session.

Tap Here to Register for Free

As you watch - you’ll discover…

  • Why the most popular technical indicators (including Bollinger Bands and Moving Averages) may be tricking you into money losing entries and exits.
  • A set of little known technical indicators that give you the “pulse” of the market - so you can predict major price movements with 66%+ accuracy.
  • AND the truth about The Momentum Factor - How THREE indicators can deliver potential account growth of up to 30,000%

You have a limited time to watch…

Register For The FREE Training Now ← Click Here

THE SPECIAL OFFER

Get the exact strategy that, with my rules, has generated a 26,654.82% return over the last 6 years…

ABOUT THE AUTHOR

Author: Roger Scott, Founder
Company: WealthPress
Website: wealthpress.com
Services Offered: Trading Courses, Mentorship,
Markets Covered: Stocks, Options, Futures, Forex

WealthPress is widely known for providing traders around the world with the very best in short-term and day trading methodologies.

Chapter
02

Our Favorite Markets and How We Trade Them

By Steven Primo, ProTraderStrategies.com

With today's increased volatility, stock trading has a high potential for consistency. At this point in history, the stock market is our favorite market to trade. Our preference can change depending on where volatility goes. If volatility shifts to commodities or currencies, then we focus on those markets.

Just because we have volatility doesn't guarantee success. In order to be consistent, you must ask yourself these questions:

  • Am I on the right side of the market?
  • Where do I place my initial stop?
  • What is my profit target?
  • How do I protect my profits?

If you have a methodology that addresses each of these questions, then the only thing left to do is watch the trade unfold. In this video, I will address each of these questions, and show you how to trade with greater consistency.

THE MOVIE: OUR FAVORITE MARKETS AND HOW WE TRADE THEM

THE SPECIAL OFFER

Get My Primo Strategy #4

  • Instant Course Access
  • Detailed Instructions (15 video course lesson)
  • Entries, Exits and Stops
  • Educational Signal Alerts
  • Includes Add-Ons
  • Educational Mentoring Correspondence

Works on All Markets and Time Frames

ABOUT THE AUTHOR

Author: Steven Primo, Founder
Company: Pro Trader Strategies, Specialist Trading
Websites:  ProTraderStrategies.comSpecialistTrading.com
Services Offered: Trading Courses, Trade Signals, Member’s Section, Videos
Markets Covered: Stocks, Emini Trading, Forex, Day Trading, Swing Trading

Scores of students, from beginner to advanced levels, have gone on to become successful traders after being introduced to Steven’s proprietary methods of trading.

Chapter
03

Simple Volume Profiling Profits

By Jay Taylor, NOFT-Traders.com

Welcome to the money room. 
(Fresh blood always welcome.)

n any market, if you don't know who the sucker is... well then you're probably the sucker.

For $50,000 you can buy into an exclusive game in the VIP room at the Viper. Otherwise known as the ‘money room’, you’ll find yourself seated with Tobey Maguire, Ben Affleck and Leonardo DiCaprio… for starters.

The stakes are high, the company is rarified and they’re always looking for fresh meat to fleece. No cameras, table stakes only and crybabies should stay at home. Like institutional traders, they’re not interested in hanging out or being friends.

They’ve come for your money. How you fork it over is entirely up to you.

Whether you realize it or not, the VIP room at the viper isn’t that different from any futures market you’ve ever looked at. Swap out the velvet curtains for trading platforms and charts. And just yank DiCaprio from his seat and put an institutional trader in his place. The results will be the same.

Every second of every day, in every futures market - a retail trader walks straight into an institutional buzz saw. With stars in their eyes and a big pot of profits on their mind - they haplessly make entries that have no shot of winning.

Just like the star-struck suckers that find themselves in the ‘money room’, retail traders have no idea what’s happening as their account is drained right before their very eyes.

Those swings? They’re not real. The support and resistance levels you’ve been looking at? Forget about them, they’re not real either. If it gives you any comfort, just about everything you’re looking at on your chart to qualify an entry is wrong.

And the institutional trader, sitting across the table from you with that smirk on their face? They know it.

If you’ve hand more than a few perfectly good trade set-ups go wrong, you’re in good company. There are millions of retail traders out there wondering exactly what an institutional trader knows that they somehow don’t.

Well it’s very simple. And it’s completely overlooked by 95% of the retail trading public.

What they always seem to know. 
(Almost as though they can see your cards.)

6%!!!??? Those are the exact odds an institutional trader wants you to take into a trade. Because you can't see what they see.

Doyle Brunson, one of the world’s most celebrated poker players has everything you’d hope for in a gambling icon. To start, there’s the 10-gallon cowboy hat. Just under the brim, an expressionless dead stare that you’d admire if it wasn’t so intimidating.

He even has an opening hand named after him, the 10-2 - which he rode to two championships. If you’re thinking that 10-2 is a crappy hand to lead off with - you’re right. Your odds of winning are less than 10%.

Yet, those are pretty much the odds that most retail traders enter with. Why? They’re looking at candles and price. Their indicators are also looking at price, with a red or green arrow at the ready. Many simply believe that if they can capture even the smallest of price moves, they’ll profit. The chances of that happening consistently?

Somewhere south of zero.

An institutional trader would never take those odds, much less contemplate that type of trade. This is because they’re looking for completely different entry conditions. Sure, they keep an eye on price, but they don’t dwell on it - that’s just the current score.

Instead, they’re watching something that gives them a far better sense of what price is going to do. It’s the very element that shapes a market and effectively gives the institutions x-ray vision.

It’s not iron or plutonium. You won’t find it on the elemental chart. But it’s the one thing that precedes price. Volume. And not just any volume, the market market’s volume profile, detailing exactly what it’s preferences are at each price level.

Think of it as the market’s very own ‘tell’. An indication of when it will be going all in, or essentially folding when it reaches a price zone, or even a specific level.

This is exactly what the institutional guys across the table are watching for.

The market’s tell. 
(When to walk away, and when to run.)

Allegedly, World Series of Poker champ Jamie Gold nearly lost his entire bankroll at the Viper in the money room game. Either he lost a step, or someone saw something that he hadn’t. In any event, he couldn’t have been an easy mark.

Not the case for the millions of retail futures traders that unknowingly enter the market, not having any idea where they are, the game they’re stepping into - or what the stakes are. Talk about easy pickings.

If you know what to look for, volume will reveal the market’s hand, well in advance.

There are no complicated algorithms involved. You don’t need a PhD in anything to spot it. In fact, once you know the conditions to look for, you can literally watch as the market sweats and fidgets in front of you.

Like an amateur poker player with a royal flush or a high schooler on prom night - it will be impossible to miss what’s on the market’s mind. Sure, the institutional traders are smart - but they’re not superhuman. They simply know what to look for and what specific price levels to stalk.

Why? Because volume is a direct indication of value. When the market perceives a decent value - volume goes up. When it thinks conditions are getting oversold or overbought volume goes down. It’s that simple.

It it’s gone ‘all in’ in the past at a specific price level, there’s an excellent chance it will do it again, when it revisits that price level. If it’s backed away from the table and headed for the restroom at a different price level - guess what, odds are good that it will do it again.

95% of the retail trading public tries to predict these moments, with little or no visibility as to where they are or when they’ll take place. Institutional traders?

Well… they can see them… wait for them… and trade them.

Entering with swagger. 
(Because the market has tipped its hand)

If you’re an amateur, fear is a very difficult emotion to conceal. The outward physical signs are impossible to miss. Your heart rate starts to increase, there may be visible sweating, shortness of breath, trembling. Not the best condition to be in if you’re entering, or trying to manage a trade.

Imagine the weight that would be taken off your shoulders if you no longer had to guess where you should be entering. If you could visualize the market like an institutional trader, simply by looking at the market’s profile. This is the key to making high probability entries.

When an institutional trader sizes up a trade, they are waiting on market extremes. Specifically, moments when value reaches frothy, overbought conditions or ice cold oversold conditions. They do this by monitoring the value zone - the price range where 70% of the volume is taking place.

Why? Because when price breeches a value zone either at the top or the bottom, price has a habit of pulling back and/or retreating. These are the reversal moments that consistently profitable swing traders are looking for.

To illustrate, check out the ES chart to the right. Notice the reversals that seemingly come out of nowhere? If you’re reading chart patterns, chasing candle tails or leaning on a lagging indicator - these are missed opportunities. Or potentially huge losses in the making.

Sure, you could ‘look left’ as a lot of old school educators would tell you. Or you could evaluate volume performance by looking at a market profile.

Look at the same chart with a 45-day market profile applied. The same exact market just had the covers pulled back. You now know in an instant what price levels are too expensive, dying for a sell - and what price levels are too cheap - begging for buyers to come in.

Why pay attention to volume? Well, 90% of it is driven by institutional traders. When they back away or come in - you’ll want to know the price levels they’re interested in. From this perspective, you can start to see why price suddenly becomes a footnote.

Instead, you’re now watching to see where volume picks up and drops off. That middle portion of the profile that’s gray? That’s the value zone - where 70% of the volume takes place - otherwise known as the ‘sucker zone’.

Within each of the value zones that volume defines, there are price levels where the market has gone all in - and others where they’ve backed away from the table. A detailed market profile reveals this with high and low volume nodes. Like a poker player that’s grinning inside, or about to lose his lunch, you can spot them easily as long as you know what to look for.

In this case it’s simply a matter of looking for extremes as noted with the same ES chart below. High volume nodes will spike out and low volume zones or nodes will create depressions or dips in the profile.

If you’re wondering how these nodes translate to intraday locations… look below. In each instance, you’ll see that price has a healthy respect for the volume that’s preceded that level.

Simply being able to this gives you the ability to enter with Doyle Brunson-like confidence. Instead of bluffing, you can patiently wait on price to approach these levels and make your move. Now all you just need to exit.

Counting your money. 
(When you’re sittin’ at the table)

If by now you’re humming The Gambler, by Kenny Rogers, you’re probably thinking about the exit. That’s right, knowing when to ‘fold ‘em, walk away or run’. If making an informed entry is enough of a challenge, targeting the right exit can seem downright impossible for many traders.

For most, the idea of ‘letting profits run’ is a fantasyland concept that has no real place in a place like the ES, 6E or even the CL. Every second of every session, exits are often made far too early, or well after crushing losses have been incurred. Hardly ever at the right moment.

This is where institutional traders, looking at a market profile shine. They have the benefit of seeing and knowing exactly where the high probability exits are. This is because they’ve plotted high and low volume nodes in advance.

Why do they watch and jealously hold these keep these levels to themselves? Because it’s where price has a habit of bouncing. If price breaks through, they watch for the next high or low volume node and again plot their next target for an exit. 

It’s like being able to sit at a poker table and know exactly which player is going to fold or call - well before they even look up from their cards. If you’re attempting to manage your trade without knowing these levels - you might as well toss your hard-earned profits out the window.

Going back to our ES, now on a 7-minute chart, you can see how price respects these levels - and how they can be used to plot your exit.

Leave the guessing and the worrying to the millions of traders willing to give their profits back. Stalk these levels with confidence, and if you’re entering with multiple contracts - know exactly where and when you’re going to take money off the table.

When price legitimately breaks through a volume level - target the next. Manage your risk and take your profits confidently along the way.

A professional poker player never heads to the table without a plan and the patience to execute. Likewise, never head into a market without knowing:

• What the long-term profile looks like and where the value zone is.

• Where the high and low volume extremes (nodes) are.

• What high probability entries you’ll patiently wait for.

• When and where you’ll exit based on volume.

And forget what Kenny Rogers says. Count your money when you’re sitting at the table.

THE SPECIAL OFFER

Did you know you can take the guesswork of trading a market's volume profile?

Winning trade locations are right under your nose. Here's a step-by-step on demand series that will take the guesswork out! Complete with entry and exit examples. Click below to get the Simple Volume Profiling Strategy.


CFTC RULE 4.41 - HYPOTHETICAL OR SIMULATED PERFORMANCE RESULTS HAVE CERTAIN LIMITATIONS. UNLIKE AN ACTUAL PERFORMANCE RECORD, SIMULATED RESULTS DO NOT REPRESENT ACTUAL TRADING. ALSO, SINCE THE TRADES HAVE NOT BEEN EXECUTED, THE RESULTS MAY HAVE UNDER- OR OVERCOMPENSATED FOR THE IMPACT, IF ANY, OF CERTAIN MARKET FACTORS, SUCH AS LACK OF LIQUIDITY. SIMULATED TRADING PROGRAMS IN GENERAL ARE ALSO SUBJECT TO THE FACT THAT THEY ARE DESIGNED WITH THE BENEFIT OF HINDSIGHT. NO REPRESENTATION IS BEING MADE THAT ANY ACCOUNT WILL OR IS LIKELY TO ACHIEVE PROFIT OR LOSSES SIMILAR TO THOSE SHOWN. GOVERNMENT REGULATIONS REQUIRE DISCLOSURE OF THE FACT THAT WHILE THE TRADING IDEAS AND TRADING METHODS SHOWN ON THIS WEBSITE MAY HAVE WORKED IN THE PAST; BUT PAST RESULTS ARE NOT NECESSARILY INDICATIVE OF FUTURE RESULTS. WHILE THERE IS A POTENTIAL FOR PROFITS THERE IS ALSO A HUGE RISK OF LOSS. A LOSS INCURRED IN CONNECTION WITH TRADING FUTURES CONTRACTS, STOCKS, OPTIONS OR FOREX CAN BE SIGNIFICANT. YOU SHOULD THEREFORE CAREFULLY CONSIDER WHETHER SUCH TRADING IS SUITABLE FOR YOU IN LIGHT OF YOUR FINANCIAL CONDITION SINCE ALL SPECULATIVE TRADING IS INHERENTLY RISKY AND SHOULD ONLY BE UNDERTAKEN BY INDIVIDUALS WITH ADEQUATE RISK CAPITAL. AN INVESTOR COULD POTENTIALLY LOSE ALL OR MORE THAN THE INITIAL INVESTMENT. TRADERS INNOVATION LLC NOR ITS BRANDS NOFT-TRADERS [NOFT], INSTITUTIONAL EDGE SYSTEM [IES], ORDER FLOW ADVANTAGE [OFA], ORDER FLOW PRO [OFP], FOREX ALPHA [FXA], NAKED PAIRS [NP], ADVANCED TRADING GROUP [ATG], ADVANCED MENTORING GROUP [AMG], NO GAMBLE OPTIONS [NGO], NO GAMBLE OPTIONS TRADING [NGOT], NO GAMBLE OPTIONS INCOME [NGOI] DO NOT OFFER TRADING ADVICE OR RECOMMENDATIONS. ALL INFORMATION ON THIS SITE IS PROVIDED FOR EDUCATIONAL PURPOSES ONLY AND NOT AN OFFER OR A RECOMMENDATION TO TRADE FUTURES CONTRACTS, STOCKS, OPTIONS OR FOREX. TESTIMONIAL DISCLAIMER: TESTIMONIALS APPEARING ON NOFT-TRADERS.COM MAY NOT BE REPRESENTATIVE OF THE EXPERIENCE OF OTHER CLIENTS OR CUSTOMERS AND IS NOT A GUARANTEE OF FUTURE PERFORMANCE OR SUCCESS.

ABOUT THE AUTHOR

Author: Jay Taylor
Company: NOFT Traders
Website: NOFT-Traders.com
Services Offered: Training, Funded Trading
Markets Covered: Futures, Stocks, ETFs 

The NOFT team is made up of highly respected institutional trading figures in the professional trading world. With decades of experience, they’ve been top performers in premier Prop firms in the U.S. and Europe.

Chapter
04

THE BITCOIN BOX: MY FAVORITE DAY TRADING STRATEGY

By Rob Booker, Robcoin.com

Imagine trading a financial instrument that moves 10% per day. Almost every day.

If you want to come along for the ride, scroll forward, my friend. We’re in for a wild ride together.

And – before I get too far down the rabbit hole – shoot me a message anytime at rob@robcoin.com – I’d love to hear from you. Tell me about your journey into day trading the crypto market.

And now…

It all starts with a story.

PART ONE: Meet Christina

I met Christina at one of the trader shows. It was the Trader’s Expo in Las Vegas in October of 2017.

She was standing at the door to my presentation room, checking her phone. Because I’m naturally gifted at conversation (this is not true), I decided I’d ask if she was checking prices.

“Oh yes,” she said. “I day trade Bitcoin.”

Day trade? I thought.

Every person I’d ever met was just buying and holding coins.

“You day trade it?”

“Yep. Right from my phone.”

And sure enough, she did. She sat down for a few minutes and showed me what she was doing.

Here’s what her phone looked like:

That’s a current shot from my phone – I didn’t ask her to give me a screen shot from hers (ok, I did, but she refused, haha).

She was charting and trading right from her phone, and here’s what she told me.

“I used to day trade stocks. I lost money. Then I did options for a while, and everyone seemed to be making money except for me. Everyone was talking about how easy it was. But I started to feel like they were either lying or I was stupid. And I don’t think I’m stupid.

“So one day I followed a link online and opened a cryptocurrency trading account. And I never looked back. I found something that was working for me, instead of me working for it.

In other words, she stopped struggling.

And she started winning.

I’d been trading for 17 years and I knew exactly what she was talking about – sometimes if we just change what we’re trading, we do better. Sometimes it’s all about finding something that’s a better fit.

That day, I dropped everything I was doing, and I started mapping out how my current strategies – the ones I’d built over 17 years – would work on the crypo market.

And I was shocked. Everything I was doing in forex and stocks worked better, and more easily on cryptocurrencies and altcoins.

And then it struck me: I knew exactly how I wanted to trade this market.

I went back to the hotel bar, grabbed a drink, and scribbled this diagram on a napkin:

That silly, simple diagram led to the single highest-probability trading method I’ve ever used.

And I’d like to share it with you.

But first, a WARNING:

  1. If you like complicated stuff, this isn’t for you.
  2. If you like fancy indicators, this isn’t for you.

You see, I don’t like complicated stuff. In 17 years of trading, I’ve made most of my money doing things the simple way.

So, if you like simple, this is perfect for you.

If you like doing things the easy way, this is perfect for you.

If you have 12 minutes a day – which is a perfect amount of time – this is perfect for you.

And no one is even looking at this right now.

So – with that said – if you’re ready … let’s get into it.

PART TWO: Why Day Trade Bitcoin and Altcoins Instead of Stocks, FX, or Options?

There are three reasons you should consider day trading cryptocurrencies:

  1. They move A LOT. Every day.
     
  2. They trend. Better than anything else I’ve seen in 18 years.
     
  3. They’re “technically obedient” – meaning, your favorite indicators will work as well or better on cryptocurrencies than anything else you’ve been trading.

If you’re winning already at forex, or options, or stocks – this is a great addition to what you’re doing. And if you’re not winning already – this just might be exactly what you’ve needed.

A common misconception about cryptocurrencies:

People think that buying and holding Bitcoin, or Ether, or one of the other coins, is the best way to get involved. That’s crazyballs. That’s insane. And not even close to being true.

Here’s why you don’t want to just buy and hold Bitcoin (or any other cryptocurrency):

  1. One day Bitcoin (and all the coins) is gonna crash. And it’s gonna be nasty. Why would anyone want to be holding onto a ton of Bitcoins on the day it crashes? When you day trade – you’re settling up your trades every day. No need to worry about what happens overnight.
     
  2. You reduce your time in the market. No more endless screen time!
     
  3. You stay in the market for a big trend, and then you get out. No more holding during the time it just moves sideways.

The big, established coins give us the chance to:

  1. Make money on predictable, repeatable patterns – daily.
     
  2. Cash out at the end of every trading day – so you’re not holding positions overnight.
     
  3. Have the potential to make gains of 5-10% every day.

If that sounds good to you, then you’re in the right place.

The biggest opportunity in 2018 is in day trading bitcoin, Ether, Litecoin – the majors. They move. A lot. They trend. All the time. And your favorite indicators work brilliantly on them.

Let’s make some money.

I’d like to share my favorite strategy with you.

For trading, I trade on Poloniex and Bittrex, and I’m opening up new accounts all the time to test out the exchanges (and do some arbitrage, as I’ll explain later).

A COMMON QUESTION: WHY WOULD I SHARE MY FAVORITE STRATEGY?

If something is working, why not just make money from trading it? Why share it?

That’s a totally reasonable question.

And I’ve got two answers.

First: When I share what I’m doing with a big group of people, and we stay in touch with each other about it, I do better. We refine the strategy together, we improve it, we test it. I’ve been sharing strategies with traders for 17 years – and most of the time for free – because it helps me make more money.

Well, actually, I only have that one answer. Ha. I enjoy sharing – and it helps me improve the strategies that we trade together.

PART THREE: The Bitcoin Box                                                                                  

To trade this method, you simply need the following:

  1. A 5-minute chart for Bitcoin.
     
  2. The Stochastic Oscillator, set to 30,10,10.
     
  3. A watch. (haha)

Here’s the step-by-step method:

  1. At 10 A.M. EDT (New York) each weekday, you’ll check to see if the Stochastic is overbought or oversold.
     
  2. If it’s neither – that’s great, you can proceed to the next step.
     
  3. Draw a box around recent price leading up to 10am. Start around 6am, and pick a high and a low – then draw a box around that price. That gives you about 4 hours of price action to use for your box.

Here’s what it will look like:

Let’s walk through each item step by step:

  1. Step 1 – we check to see if it’s 10 A.M. EDT It is, so we can move ahead.
     
  2. Step 2 – is the Stochastic overbought (above 70) or oversold (below 30)? No, it’s not. So we can move forward.
     
  3. Step 3 – we draw a box around recent price action. I know that the box I drew looks terrible. Haha. I just free-handed it. I was not born to be an architect.

Now, once we have our box drawn, we can wait for price to break out.

The chart above explains it all.

When price breaks out above the box, we buy.

If price then retreats back down to the top of the box – that top of the box becomes support. And we can buy it again at that level.

Our stop-loss easily goes right inside the box – either right below the top of the box for a tight stop, or halfway the distance into the box for a slightly larger stop. I don’t recommend placing large stops (for example, below the bottom of the box). Large stops are a great way to lose large amounts of money.

For a target, we have a few options:

  1. We can wait until the Stochastic goes overbought, and then start to exit the trade.
     
  2. We can set a profit target equal to the size of the original box. So if the box is $50 from top to bottom – then our profit target can be $50. You might want to set a target at $45 to account for spread and volatility.

Those are my two favorite ways to set targets.

Now, all of this is reversed if price breaks out the bottom of the box. In fact, when price breaks out lower, I like to set bigger targets because Bitcoin falls faster than it rises. So when you get a winning trade on the sell side – it can pay to ride that a little bit longer.

This entire process takes about 12 minutes each day.

I go to the charts at 10am, set the box, set my orders, set my stop and target – and then walk away. I do better when I don’t touch it or monitor it.

PART FOUR: The Bitcoin Box on Steroids

Now – we can take this little strategy even farther if we do a two simple things:

  1. We can buy the Bitcoin (or sell it) on one exchange, and then close the trade on a different exchange – for a huge increase in profits.
     
  2. We can limit our trading to certain days of the week when these breakouts are especially volatile (and have a lot more potential to move 5-10% in just a few minutes).

If you’d like to take this a step farther – visit me at RobCoin.com and I’d be happy to help out. And stay in touch anytime – just drop me a line at rob@robcoin.com, day or night.

ABOUT THE AUTHOR

Author: Rob Booker, Founder
Company: Robcoin.com
Websites: RobBooker.com  Robcoin.com
Services Offered: Trade Alerts, Robots, Trading Indicators, Podcast, Trading Rooms
Markets Covered: Forex, Futures, Stocks, Cryptocurrencies

Rob currently hosts of The Trader’s Podcast (available on iTunes) and is the author of the book “Adventures of a Currency Trader: A Fable about Trading, Courage, and Doing the Right Thing.“

Chapter
05

The Best Performing Indicators for Trading ETFs

By Kirt Christensen, ETFTippingPoint.com

The ETFs market is a huge reflection of crowd psychology playing over two basic human emotions; greed and fear. Professional ETF traders understand this, and rather than relying on greed and fear, they keenly follow the mood of the market as informed by technical analysis and/or candlestick patterns.

Technical analysis of any price action is done through indicators which derive their strength from past price actions. Indicators are powerful tools for predicting market trend, market momentum, volatility, stop-loss targets, and more. Technical indicators are valid for all tradable instrument including individual stocks, indexes and ETFs.

In theory, following any one indicator can be lucrative but it’s coupled with an equally high risk of loss. As such, in real life situations, it's best to make trades based on holistic analysis using multiple indicators. You should look at points “where all the stars are aligned” and where every, or at least most of the indicators, predict the same outcome. For example, look at the RSI, Bollinger Bands, Keltner Channel, different moving averages, Stochastics, and several other indicators before making a trade.

In this chapter, we are going to look at the best performing indicators for ETFs; indicators that give the highest success ratio.

You can use any type of candlestick to go with the following indicators, but we recommend using Heikin-Ashi Candlesticks, as the charts are smoother and less noisy compared with normal candlesticks. Even better, almost all modern trading platforms have the option of Heikin-Ashi Candlesticks.

1. Moving Average- The Market is a Dance of Moving Averages

One of the most important concepts in the Dow’s Theory is moving averages which depict the entire history of an ETF. Moving Average is a good compass for market trends and a good basis of establishing support/resistance levels. There are two types of Moving Averages; Simple and Exponential moving averages.

Traders who prefer longer period trades should go for simple moving average and high-frequency scalpers and quick traders should use the exponential moving average.

The success ratio of moving average as a sole indicator is over 60%, and when combined with other indicators, it becomes one of the most powerful and core indicators of any trading strategy, yielding up to 90% success rate. Most trading platforms offer Simple Moving Average (SMA) and Exponential Moving Average (EMA) for different time periods like 5m, 15m, 30m, 1 hr., 1 day, 1 week, 1 month, etc.

Depending on your trade’s time frame, you should choose three different moving averages. Moving averages of different time frames tend to converge and diverge according to the market trends. The point where two moving averages meet is the point where you should execute your trades.

Typically, go long once you see a MA of lower time frame “crossing over” a MA of higher time frame. It means that the stock/index/fund is in a positive momentum or is simply bullish. Take a short position if the reverse happens. Moving Averages, if used with right combinations, can predict the broad market trend accurately.

Let’s take a closer look at a simple example of how moving average can predict a price action.

Illustration 1:

The chart below shows a classic example of a profitable trade, using the concept of moving average. The ETF we chose was SPDR S&P 500 ETF Trust (NYSEARCA: SPY), over a weekly period. The red line represents the 20-day Simple Moving Average (20 SMA) and the green line represents the 50-day Simple Moving Average (50 SMA).  

We see an extended period of consolidation from the mid-2015 to the beginning of 2016, where the 50 SMA was above the 20 SMA. However, there is a strong 20 SMA crossover at 210 level. Since this is a weekly chart, the indication is a strong one, and this is evinced by the subsequent price rise towards 240 levels, with a final high of 245 giving a neat and clean 14% return.

If you are a skeptical trader and want to be sure before executing the trade, look at the MACD, which is making higher highs and a positive divergence after the SMA crossover. That is a high probability uptrend that you can bet on.

Here is a similar example, but for a downtrend, where you can earn money by going short. The red line is 20 SMA, which is crossed over by the bigger 50 SMA. Notice that the crossover takes place at 140 level and during a negative divergence (-0.84) between the MACD and EMA. This signals that the bears are in control, and it’s a powerful sell sign.

Moving Averages can also be used as reliable resistance and support levels. Resistance levels are points which act as a strong bearish wall, while support is the line which provides good “bouncing” points for the a given price. For example, in the above chart, the 20 SMA (the red line) acts as a strong resistance for the downtrend. Notice that, whenever the price touches or tries to pierce the 20 SMA, it intensifies the downtrend. This can be used by short time traders to place profitable shorts. Other than the 20-50 Moving Average combination, you can also use the 50-200 SMA to get a broader perspective into the ETF.

2. RSI – Locating the Greed and Fear.

The two most fundamental forces that control the market is greed and fear. It is a well-known saying that "bulls make money, bears make money, pigs get slaughtered", personifying pigs with greed. The best way to quantify fear and greed is to use oscillators indicators, like the RSI (Relative Strength Index). Note that Relative Strength Index is one of the most important and handy indicators, especially for swing traders. It is a momentum oscillator and is used to verify the momentum of a trend.

The concept of RSI is simple to understand and easy to apply. RSI, like most oscillator indicators, is a band which indicates overbought and oversold conditions in a price movement.

The RSI indicator moves like a pendulum, swinging between the two extremes of overbought and oversold conditions. The actual level is determined by the technical set-up, but usually, if RSI crosses over 80, it creates an overbought situation while any level lower than 20 becomes an oversold situation. The more it deviates from these extremes, the greater is the tendency to revert to the mean position. In any trade, the RSI value can’t move lower than 0 or higher than 100.

The logical course of action is to sell when RSI value increases beyond 80 (overbought), and buy when RSI falls below 20 (oversold). Now there is no compulsion for the RSI to go beyond 20/80 to be justified as oversold or overbought. It has to be combined with a trend indicator and candlestick patterns.

Let’s look at an example.

For simplicity, we will not complicate the chart with other indicators, but it’s advisable to take multiple indicators into account before making a trade.

Below is an iShares MSCI Emerging Markets ETF chart, with a 14-day RSI indicator, which is the last column. Notice that the given setup has a RSI band between 88.43-15.79, i.e. the extremes which indicate it’s specific oversold and overbought conditions.

Notice the first dip in RSI happens somewhere around September 2015, when the price was $550 and RSI was 15.79. This indicates a strong oversold condition and professional traders would take a long position at this level.

The price goes to $600 a share and then moves back to $550, but the RSI value is locked at 33. This means that there is a potential uptrend and the stock still has an inner momentum. The momentum is finally confirmed with the SMA crossover in mid-2016 after which the price of the ETF goes off to $800, which is a comfortable 30% return.

Now, notice that once the trend is confirmed by the SMA crossover, the RSI never went beyond 50 in the year 2016. This indicates the presence of a strong bullish momentum and you can look to buy into the dips. Again, you can safely use the 20 SMA (the red line) as a strong resistance for buying into the momentum.

Here is another example of RSI, where it locates an overbought condition in the daily chart of iShares MSCI Germany ETF. The 14-day period RSI is used.

Notice that the RSI has peaked itself in January 2017, and is somewhat consolidating at the $580-$570 levels. With a number of Doji candlestick patterns appearing in the consolidation phase, after an uptrend, it clearly indicates a period of indecisiveness in an overbought area. This is where a smart trader would take a short position. The price eventually reaches 520 within 2 months, giving off a 12% profit over a short period of time.

RSI can be used for a smaller time frame, even for hourly traders. However, it is wise to check on the general RSI value before trading within specific time frames. For example, if you want to trade within the hourly chart, you should be aware of the RSI value on the daily chart. The RSI indicator for smaller time frames (like 1m, 3m, 5m) can be fickle and sometimes oscillate too sharply. You can then use a 21 or higher period RSI to smoothen the oscillation frequency.

3. Fibonacci Retracement- What Goes Up, Must Come Down.

One of the fundamental characteristics of any ETF/index/stock is the bearish and bullish forces, which create a zig zag pattern in the charts. No stock price ever goes on increasing and no stock price can always remain in a downtrend. Many swing traders take advantage of this to execute quick trades, with well-defined stop-losses.

In any trend, the momentum first increases and reaches a peak from where it collapses, taking the price of an ETF down to a certain level, before reverting to its original trend. Hence, this requires a specific stop loss, which is provided by the Fibonacci Retracement indicator. These pullbacks, which are known as retracements, are temporary and provide nice opportunities for quick traders to make profits in overbought/oversold conditions, and a chance for momentum traders to exploit the general trend.

According to the Fibonacci Retracement theory, any trend will have strong resistance/support at 23.6%, 38.2%, 50%, 61.8% and 100% of a fully established trend. The overall trading strategy is formed by looking at these consecutive support/resistance levels. For example, if an ETF is making higher highs and higher lows, then it is in an uptrend, and generally, the resistances become the new support bases.

Below is a pictorial representation of this type of movement. The first movement marked in green is a clear bull run, the blue part is a consolidation phase, and the red part depicts a typical bearish grip.

This movement is quantified by the Fibonacci Retracement in strong trends, which predicts strong reversal tendencies at the 5 fundamental levels/ratios; 23.6%, 38.2%, 50%, 61.8% and 100% of a price movement.

Here is an example of Fibonacci Retracement (FR), appearing on a daily chart of FXG, a consumer staples ETF.

The Fibonacci Retracement is constructed using two extreme points, one is the starting point of a trend and the other is the peak of a trend. Both points are further verified by candlestick patterns and other technical indicators. In the following example, we take the $21 as the lower level of the Fibonacci Retracement and $25 as the upper. 

After achieving a $4 rise, over a $20 base price (20% increase), from February to June, we see the appearance of an Evening Star Doji on June 1. This indicates a clear loss of momentum and a signal that the bears have taken over the market. The price falls off through $1, which is a 1/4th increase. This corresponds to an approx 23.6% fall from the first phase of the trend. Once you see this fall, you know that this level becomes the new resistance and price will be forced to bounce off this level.

Professional traders will use this dip to go long again at $23.65 and experience the next leg of the bull run. This will actually continue off till the next Fibonacci level of 38.2%, which will become a temporary resistance and then change into a support, with further uptrend.

This is similarly true for a downtrend, when the price springs up temporarily before continuing the bearish run.

Almost all trading platforms have the Fibonacci Retracement and it can be used by professional players for scalping a trend for quick profits or entering a fresh position at such temporary retracements. This is also a good indicator to analyze the shifting resistance and support bands, which can help us determine our target and stop loss.

4. Bollinger Bands: The Mean and the Two Deviations.

Bollinger Bands is a classic indicator, developed by an astute trader, John Bollinger. He devised a simple way of tracking the deviations from a particular moving average, usually a simple moving average, by creating a parallel running bandwidth. The bandwidth encompasses the “highness” and “lowness” of a price action and is a good measure of volatility.

Bollinger Bands consists of a main N-period Moving Average, which is the middle line and two standard deviations, forming the upper and lower limits of the bandwidth. The way these bands are pierced can tell a lot about the underlying forces.

Let’s take a look at a natural piercing of the 10-day Bollinger Bands, through a daily chart.  In the given figure, the middle blue line is actually the 10-day SMA, the green line represents the upper deviation (Upper Band) and the red line represents the lower deviation (Lower Band).

Notice that, at the end of January 2017, there is an unusual expansion of the Bollinger bands. The candlestick pieces into the upper band with a strong but gradual uptrend, taking the price from $80 to $120. The stronger the piercing, the stronger is the inner momentum and volatility in the ETF. Once the price consolidates to a new level, the Bollinger bands constrict itself to the mean position.

Bollinger bands are also used by swing traders to take advantage of sudden price movements. Since the price always tends to revert to the mean position after a sudden deviation, some traders immediately revert the Bollinger trend to make quick scalping trades. 

In the above diagram, when the price starts to drop during February and March, the Bollinger bands again expand and the candlesticks touch the Lower deviation band (red line). We can also see a strong MACD crossover at the end of February, signaling a losing momentum.

There is an unexceptional spike in the Average Volume indicator, signaling a strong bear run, which eventually brings the price down to $80.

As a golden rule while following Bollinger Bands, always buy if there is a gradual expansion towards the upper band and sell once there is a strong deviation from the mean band towards the lower band. 

5. VIX Index- Only Thing We Have to Fear Is Fear Itself.

VIX is a 30-day volatility index, which is also known as the Fear Index. It is not available for individual stocks but assumes prime importance in the technical analysis of ETFs, currencies, options, and other indexes. VIX is basically the volatility index of Chicago Board Options Exchange (CBOE), the world’s largest exchange.  It measures the probabilistic volatility of the S&P 500 Index options and is one of the best ways to get an idea of the general market direction. VIX is usually inversely proportional to the S&P 500 index and consequently all the linked ETFs.

Below is a VIX vs. S&P 500 chart, where you can see the inverse correlation between the two.

The VIX indicator is measured as a percentage, which predicts how the market will go based on its current activity. Rapid changes in the market forces will trigger a rise in the VIX indicator, which can signal zones of danger to avoid. The VIX indicator particularly becomes very active, achieving 70-80%, before and during a period of burst and reverts towards 10-20% during periods of boom.

Most of the time, the VIX indicator tends to stay below the threshold value of 20%, which indicates normal market activity. Any sharp spike in activity/volatility is reflected by an increased VIX, which sharply reverts back to the original. This phenomenon can be seen in the above graph, which shows a sudden spike just before the 2008 financial meltdown when the VIX touched a record 82%. Since then, the VIX experienced momentary bursts, notably during a 10% movement in the S&P 500 index (2010-2011).

A decreasing VIX, however, indicates a rising market for S&P 500 ETFs. The market is on the rise since 2009, during which the VIX reverted back to 20-10 % levels. You should keep an eye on the VIX indicator if you are holding any long-term positions and want to limit losses during unforeseeable events.  

How to Use the Indications in Unison.

Indicators are like sticks, which can break if it stands alone but becomes powerful when many are bundled and used in unison. The key to successful trading, therefore, boils down to harmonizing the various signals from different indicators into a comprehensive picture. This does require some experience to actualize during live trading sessions, but finding common ground between various indicators is the bedrock of successful trading.

The chart we will be using is a recent 30-mins chart for Power Shares QQQ Trust, Series 1 (ETF), and we are going to follow the ETF for a week and look at points where we can enter profitable trades based on the indicators mentioned above. The details of the indicators used in this trade are.     

  • Simple Moving Average- 20 days (red line), 50 days (green line) and 200 days (pink line). 
  • Bollinger Bands- 10 period.
  • MACD- Short Period: 12, Long Period: 26 and EMA period: 9.
  • RSI- 14 Period.  
  • Volume Moving Average- 5 Period.

This is the first chart, where we confirm the formation of a trend through the 20 days (red line), 50 days (green line) and 200 days (pink line). The 200 day SMA overtook the 50 day SMA, which signals a potential bear grip in the medium term. The 50 day SMA also closed above the 20 day SMA, which confirms a clear downtrend in the short term. We can also see that the ETF is using the 50 day SMA as a resistance to this downtrend. As this is a strong resistance, we can sell whenever we see the stock price hits the 50 SMA (Wednesday, 28 June ending, Monday July 3 beginning), once the downtrend is established.

At this point, we remove the SMAs from our chart and introduce the 10 period Bollinger band into the chart, which now looks like this.

Notice that the Bollinger band was tight and compressed from June 20 to June 23, which signals a period of low volatility and overall consolidation. Once the market opened on June 26th, you can see a spinning top Doji formation at a 30 mins level. The Bollinger Bands are starting to open up, with the candlesticks piercing the lower band. At the same time, you can see the RSI value peaking at 80 levels and MACD showing a negative divergence of -0.12, signaling a new bearish trend. This is a point where three powerful indicators point to a single thing and it can be a strong signal to sell at this point. We can take a short position here and draw a Fibonacci retracement, which would naturally layout 140, 138, 136, 134 (rounded off) as the support and resistances for the downtrend. This is exactly what the price action does, as it reverts off to 138 on Tuesday June 27. On Wednesday June 28, the price of the ETF starts off at 138, which is a temporary support. It rises but could not breach its earlier resistance of 140, which has now also become the 50 SMA-downtrend-resistance. This signals an immediate selloff in the ETF.

On Thursday June 29, many interesting things happen, which require a detailed look.

Notice, there is a strong volume growth in the opening hours on Thursday June 29th. This represent a bearish volatility, as the RSI value at 82 is suggesting an overbought condition. This is another lucrative point to sell the ETF as “all the stars are harmoniously aligned”, and we can expect the price to move down towards 36 and then towards 34. Moreover, there is a MACD divergence happening on Monday July 3, which again confirms a downtrend.

THE SPECIAL OFFER

How to Use a Ridiculously Smart, but Simple ETF System that Consistently Delivers Big Time Returns in All Market Conditions, With Lots of Compounding, Without Being Chained to Your Computer!

Learn how, I'm hosting a 90 minute, free, educational training webinar over the next few days... This mechanical, emotionless system has averaged 4.70% per month trading 9 different ETFs using a conservative, straightforward strategy, going all the way back to 2006!

It's all based on a "secret", 3 word phrase that comes from an underground 1963 book... It was penned by a controversial (but genius author) with his "big idea" updated and revamped using modern computer processing power to sift through mountains of data.

You get a "step-by-step" guide on how this all works, and how you can profit from it, almost immediately.

(You'll also learn how to apply this to 2x ETFs, and how to use simple Calls and Puts to supercharge your returns.)

This training event is 100% free to attend, but will only be held a few times this week, so register now:

ABOUT THE AUTHOR

Author: Kirt Christensen, Founder
Company: ETF Tipping Point
Website: ETFTippingPoint.com
Services Offered: Trading Education, Forecasting, Videos
Markets Covered: ETFs, Options

Kirt’s goal and passion is developing trading rules and systems that the retail investor can use to profit 5 to 10% a month, in less than an hour a week — using ETFs and Options.

Chapter
06

The J-Hook Continuation Pattern

By Rick Saddler, HitAndRunCandlesticks.com

While there are a number of continuation patterns in trading, the J-Hook Continuation Pattern is one that is a very decisive and can be easily identified since it forms the letter J.  If the chart pattern is followed, entered at the right time and unfolds as expected, it can be very profitable.  J-Hooks may also called by other names like Thunderbolts and 123 formations.

There are three basic parts to the pattern 1) a strong upward move in price 2) a pullback and 3) an up move which should continue into a breakout above the previous pivot high in price to complete the pattern and continue the uptrend.  Figure 1 presents the three price movements that take place as a J-Hook develops. 

  1. Price moves rapidly with a strong upward move in price.
  2. Price begins to pull back forming a small cup that is its signature move during the J-Hook pattern development. The pullback can be divided into three parts as follows:
  1. Price begins to pullback with lower highs, which is the start of J-Hook formation.
  2. Price establishes a low with several candles, possibly close to a support line.
  3. Price moves up toward the previous high and can meet resistance at this point.

Price breaks out above the previous high to continue the uptrend in price.

Figure 1:   The three sections of a J-Hook Continuation Pattern

J-Hooks are very easily spotted once the pattern is learned.  There are no hard and fast rules about the exact shape and minimum number of days for each candle to reside in the three separate phases of the    J-Hook Pattern.  Rarely will you see a perfect J-Hook and continuation move up that goes in a straight line.  There are some patterns that can be confused with J-Hooks as not all patterns are as clear and concise as the model depicts.  Study the charts that follow:

  • Valeant Pharmaceuticals (VRX) shows a relatively clear and easily identifiable J-Hook chart pattern in Figure 2. 

Figure 2:  A completed J-Hook Continuation Pattern showing price movement

  • U.S. Steel Corporation (X) chart shows a much longer uptrend and a deeper pullback in Figure 3.

Figure 3: A Deep and Extended J-Hook

  • Twitter Inc (TWTR) in Figure 4 has formed a J-Hook with an upward thrust that diverts from the normal accepted path of a J-Hook at two different times.  It pulls out of the upward trend for about three days and then resumes its ascent until it starts to pull back forming a cup shaped structure. Price has moved above the previous high with a possibility of moving up.

Figure 4: A J-Hook that deviates from its upward path.

The J-Hook Continuation Pattern provides no guarantee that price will move into the high probability zone, no matter how perfect the configuration. The chart on X in Figure 3 is an example of a very clear J-Hook but may be too deep and extended for some traders while acceptable to others.  The same is true of Figure 4 where not all traders would be willing to accept the pattern as a J-Hook.

Progression of a J-Hook

The following movements in a chart pattern are a must for it to be called a J-Hook. 

  1. Price action shows a strong upward trend in progress.
  2. As sellers begin to take profits at the pivot high of this move up, the upward move is interrupted causing price to pullback. 
  3. As the selling process slows down it reaches a low point, a place of consolidation (the bottom of the cup). 
  4. Price action begins to turn up and move higher as buyers begin to purchase, confirming that the pullback is over.
  5. Price action moves in an upward direction again and, as price breaks out above the prior pivot high, it continues to move in the upward direction completing the J-Hook Continuation Pattern.

In the Red Hat Inc. (RHT) chart below, Figure 5, it is in an uptrend, but will pullback or reverse the trend when sellers enter the scenario.

Figure 5: J-Hook Pattern and Price Movement into the High profit zone.

The key to recognizing a J-Hook Continuation Pattern is not just the initial upward move in price, but also the patterns that preceded the move.  The greater the number of positive signals prior to the J-Hook formation, the stronger the probability of an upward swing.  The pattern becomes more forceful if the initial move up appears after a Morning Star or Bullish Engulfing Candlestick Pattern, a double bottom, and other positive signals and patterns. See Figure 6 below.  

Figure 6:  Longer term chart pattern shows multiple positive conditions leading up to the J-Hook

Sometimes J-Hooks form above the support line with the pullback testing support.  When this happens consider it an added strength that raises the probability of a move higher.  This may take it further into a higher probability zone; if the pattern works out, it may offer more than the expected gain.  See Figure 7 on RHT below.

Figure 7:  J-Hook forms with a pullback to the support lines

Using Different Time Frame Charts

We all want charts to move up in a steady straight line, but that does not always happen and price will pullback providing another buying opportunity.  The back and forth movement can compromise the clarity we expect to observe. Many times, on a daily chart, this price action will make the underlying chart formation harder to recognize.   

I have, personally, found it more successful to use the Daily Chart.  However, a 2-day or 3-day chart may offer a clearer picture by eliminating indecisive candles and providing a better understanding of the underlying price action. Your reason for looking at longer time frames may range from being a longer-term trader or eliminating the noise on a lower time frame.

If used correctly, there are the advantages of using various time frames:

  1. A cleaner picture of what is happening to price action as it moves.
  2. Support and resistance may be seen that is not evident on a daily chart. 
  3. Recognizing a pattern that may not be obvious at first glance on a daily chart. 

Compare the Extended J-Hook daily chart on X in Figure 8 to a 3-day chart in Figure 9 and see how it displays clarity and is easier to observe. A great reason for checking out multi-day charts is to get a cleaner picture of price action that is easier to observe and understand.

Figure 8: An Extended J-Hook on a Daily chart of X

Figure 9:  A J-Hook 3-day chart of X eliminates noise

Entering a J-Hook Trade

The J-Hook Continuation Pattern is a move upward in price, a pullback and a continuation of the movement in the original upward direction as described in the sections above.  

There are four suggested areas for entering J-Hook trades.  It is always important to know that profit is not made while the pattern is in progress, but after it completes and signals that buyers are stepping in and price resumes its upward movement.  This does not mean that shorter term trades within the pattern are not possible.  Swing traders may prefer to enter the trade as the pattern develops. The four entry areas are listed below.  See Figure10.

Figure 10:   Four places to enter the J-Hook Continuation Pattern

Area 1:  Price reaches a low and consolidates with a higher low or a candlestick buy signal

Area 2:  Price is between Areas 1 and 3 where buyers can enter.

Area 3:  Price reaches the same level as the previous high.

Area 4:  Price breaks out, moving toward a new high, continuing in the original upward direction.

It is important to note that no one area is better for entry than the other.  Where you designate your entry point is a matter of personal preference. If you chose to enter at Areas 1 and 2, the probability is that you are not planning a very long-term trade.  You may want to get out at the first swing, which could be an exit at the resistance line, when price reaches the previous high.  On the other hand, if you can manage the trade all the way up for a bigger percentage gain, Area 4 may be your personal choice.  The larger profit is usually made after the chart pattern has completed. Your entry and exits should be planned with stops to preserve capital.

As a student of the Market, you may ask the question, “What should I do?”  The answer is “Be vigilant” and train your eyes to follow the chart and determine if the probability of success exists.  Remember the importance of being aware of the possibility of a J-Hook forming before, during formation, and after it has formed.  When you see the possibilities, it becomes a watch list candidate.  It will give you opportunities of entering the trade in Areas 1-4 as it moves along.  Some words of advice once again are, “Make sure you trade with a plan in place.”

All J-Hooks have an initial move up in price; however, it is unknown whether it will turn into a J-Hook as it moves.  At some point price it will start to pullback, bottom out, and turn up moving toward the previous high.  If it fails to do so and breaks a support line, it is no longer a J-Hook. 

A good way to estimate the pullback in price action is to use the Fibonacci retracement lines. Draw the Fibonacci lines on the initial upward move of the chart and determine if any of the retracement lines coincide with the lowest area of the pullback.  You can use the following as a guide to estimate the progress of the pattern as a J-Hook.  

  1. A 23.6% retracement line is my favorite for this pullback. 
  2. Between 23.6% and 38.2% retracement, the area can still be a good entry section.
  3. Below 38.2% is a gray area to be entered with a lot of caution.
  4. Below 50% the chart pattern can no longer be placed in the J-Hook category. Due to such a deep pullback, it pulls price out of the short-term swing trade range.

Check out the Sandridge Miss Trust II (SDR) chart Figure 11 below; at first glance it appears to be a great J-Hook, but price continued to move below 50.0 % and far beyond.  The blue arrows show an ideal formation of a J-Hook chart pattern.

Figure 11:   A deceptive J-Hook that ends up as a four-candle pullback.

There are no guarantees that a chart pattern will succeed or fail with the use of Fibonacci retracement lines.  It may not fully develop into a J-Hook but if the upward trend has not broken, it may still be worthy of keeping its position on a watch list.

Many high probability trades are missed because of what we think are “chart pattern failures,” so we, as traders, “fail the chart.”  We simply neglect to follow the chart and keep it on our watchlist.

Observing Failed J-Hooks

All charts can fail at any stage of the J-Hook formation before or right after the pattern completes.

You may anticipate the development of a J-Hook on a chart that shows promise, but it may not materialize and ends up with a failing reversal pattern.  It can also reach the previous high and form a double top or reverse at any point and no longer reach the profit zone.  The Sprouts Farmers Market (SFM) chart shows a J-Hook that failed prior to reaching the previous high.  See Figure 12 below.

Figure 12:  A Pattern that failed to complete the J-Hook and enter the higher profit zone.

In the US Steel Corp (X) Figure 13 below, the J-Hook failed to move up very far after the breakout even though the chart pattern is still above the bullish trendline. 

Figure 13:  A chart pattern that failed to complete the J-Hook and enter the higher profit zone.

As traders we need to keep in mind that “patience is the name of the game.”   Most of the time we give up on a failed chart pattern if it pulls back more than what our plan dictates, and we spend too much time regretting and dubbing it as a “failure.”  There are hundreds of charts that can be found even in a down trending market.  If you are a struggling trader, it is always best to trade with the trend of the market and not against it.

In Summary

The J-Hook Continuation Pattern is one that I have personally traded for many years.  It takes time to become familiar with the pattern and understand the price movements within the pattern that have proven to be most successful over the years.  The details of the J-Hook Continuation Pattern that are shared in this write up are what I have found worked best for success.  I wish you great success as you learn these details and incorporate them into your own trading program.

THE SPECIAL OFFER

To find out more about the J-Hook Continuation Pattern and other patterns we use in the Hit and Run Candlesticks and Right Way Options Trading Rooms on a daily basis, join us for a 30-day free trial to both rooms.  The Hit and Run Candlesticks Trading Room is open Monday through Friday 9:00am to 4:00pm ET and Right Way Options Trading Room is open Monday through Friday 11:00am to 1:00pm ET. 

ABOUT THE AUTHOR

Author: Rick Saddler, Founder & CEO
Company: Hit and Run Candlesticks
Websites: HitAndRunCandlesticks.com, RightWayOptions.com
Services Offered: Live Trading Room, Trading Education, Software
Markets Covered: Options, Futures, Stocks, 

Rick Saddler has 29 years of experience coaching traders to enter with low-risk on short-term trades, grabbing profits and sleeping well at night. His bottom line has become simplicity equals success.

Chapter
07

How to find high probability trading setups with consistency

By Mohan Wolfe, DayTradersAction.com

With a beautiful summer rolling in right now, it's good remember to get some free time away from the markets to reflect on your trading and the strategies you use. This simple practice will be quite valuable in keeping you consistent in your trading.

Whether you are a beginner in futures trading or have developed some experience through gains and losses, this article will assist you in achieving consistency.

I have been trading the futures markets for 30 years and I have gained a lot of experience on the long road of “the learning curve”. This means making a lot of trades…both winners and losers and gradually learning how to achieve consistency.

The proof of this can be seen in the results I have achieved in my trading services such as my “Day Traders Action Live Trading Room” and the results of traders who own my top selling “Boomerang Day Trader”.

My goal in this article is to try to assist you in speeding up your learning curve so that you can move quicker towards finding high probability trading setups with consistency.

Developing strategies that get you on the right side of the market is vital and your first priority.  Next,  the REAL KEY to trading is CONSISTENCY.

You can have some fun trading at first and certainly get some intellectual stimulation from studying the markets but CONSISTENCY is where the “rubber meets the road”.

You will not be able to grow your trading account without consistent, steady winning trades while learning how to minimize losses and commissions (by not emotionally over trading).

To start on the road to high probability trading and consistency you need to ask yourself the above questions.

I will do my best in this article to answer the above questions so that you will feel comfortable exploring the high speed, high risk and potential high profit world of futures trading.

The main question many traders will ask is: “What are the best day trading markets for futures?”

Well, the truth is there really is not a “best” market necessarily because with solid knowledge of a specific futures contract you can make ANY market really lucrative.

Deploying very specific knowledge and then “time in front of the screen” following that market to develop the skills necessary to trade successfully is the key!

My favorite markets for consistency of flow, steady continuous volume, and regular daily intraday swing moves are the Crude Oil contract (CL) and the Mini Nasdaq (NQ).

I live in the USA and the active time periods for these contracts suits my schedule well. The best trading times I have found for these contracts are the really active periods between 9:00 am EST and 12:00 am EST.

Using the very specific tools that I will show you today in this article I believe that you will be able to find consistency with steady practice and time in front of the charts.

I prove what I am saying here in the live market practically every day in my “Day Traders Action Live Trading room”.

In fact just recently we had an astounding 83 winning trading sessions in a row in our live room!  I have never heard of any other trader, CTA or live trading room in my 30 years in the industry accomplish that with their specific methods.  And rest assured if they had done that they would be announcing it and promoting that success like I have to let traders know that it is possible.

To give futures traders encouragement, support, training, instruction, precision indicators, and indeed daily live successful trading signals has been my goal in the industry for 18 years now.

I love the work I do working with traders and plan on doing this for a long time into the future.

If you get a chance, stop in my trading room and take advantage of what we offer. In fact, we are the lowest cost trading room in the industry with the strongest trade results that I have ever seen in the trading room world.

Please don’t get me wrong. I don’t say that to brag or be conceited but to encourage traders that it is possible to use the markets to carve out a regular daily paycheck on most trading days. Futures trading is a very tough business.

Always remember that futures trading is very risky and you should only be using risk capital which is defined as money you can afford to lose which by losing will not affect your lifestyle.

I love telling our traders who check out our services this important risk disclosure because this futures business will draw in a lot of people who should NOT be traders.

Out of the thousands of traders I have trained over the years (well over 50,000) a good portion of that group should not be trading the futures. Plain and simple many traders do not have enough money to trade futures and they do not want to develop the military-like discipline it takes to become a serious futures trader.

Before I get started showing you some charts along with some precision indicators I have developed let me discuss the key ingredients to futures trading.

Those 3 key elements of day trading are:

  1. You must have a solid working knowledge of your trading platform and how to execute trades rapidly. You should also fully understand how to change orders, cancel/replace orders, flatten out your positions and apply automated brackets to be sure you always have a stop on your position with your broker. Be sure to have your phone on speed dial to your broker in case all this sacred internet technology stops working for some reason in the middle of one of your trades.
     
  2. You will need to trade with a proven, tested, highly accurate and well researched day trading system that has a long time track record of success. You can find one of these rare gems (like my Boomerang Day Trader system) or take the harder route of “trial and error” to develop your own. If you choose this route just be prepared for many years of work, frustration and losses in trying to develop such a system. Oddly, although this second key ingredient is so important, I have found over the last three decades of trading and assisting other traders that this vital element is so often overlooked.
     
  3. You will need above all a crystal clear working knowledge of how to develop and maintain a “Traders Mindset”. This means knowing and understanding fully how your brain will react to the trading business and its ups and downs during your career of this high risk business. What I find truly astonishing in my many years of working with traders is the often blatant disregard for this most vital third element of successful trading.

It’s almost as if traders would rather pretend that the “Traders Mindset” doesn’t exist at all and instead would rather just say to me “just show me how to be a winning trader Mohan without the psycho mumbo jumbo”. Some of you may be thinking this right now and indeed you are the ones who need it most.

Often I have seen that it will take a trader two or three blown out trading accounts to finally start waking up and realizing how important the Traders Mindset is in the entire process. The false assumption that a beginning or intermediate trader doesn’t need to train this aspect of their trading life can be the cause of devastating financial destruction.

The brain does not like what trading does to it. It does not like to experience the fear of the unknown and the nervousness of perceived unlimited risk that can occur when you are placing your trades.

When confronted with these stimuli, the normal reaction of the brain is a "fight or flight" response. Almst every new trader that I work with goes through this. They jump out of winning trades too soon, or hold on to losing trades in hopes of a reversal.

Multiply this by hundreds of trades with losses, and you have a formula for a trading psychosis that could lead to devastating losses if not treated quickly and profesionally.

All professional athletes have personal trainers that coach them in their goals, and on how to improve their game. Usually this is trained in incremental, consistent improvements. Over time, such incremental gains can often become substantial victories.

Today I am going to show you in simple terms what really works in futures day trading

First of all I would like to establish a bit of credibility which in this futures industry is extremely important in deciding whose ideas or method you are going to use.

Below is a picture of me giving a live two day seminar to over 320 traders who flew in from around the globe to learn my trading methods. 

In attendance were over a dozen floor traders from Chicago and about 20 futures brokers.  The rest were traders ranging from large contract size pros to intermediate level traders along with new traders who were just starting out in the business. They had all heard of my successful trading services and went to great expense and effort to attend the webinars I did.

During the 2 day seminar we also had an excellent presentation from the brilliant Mark Douglas who is one of the original and best “Traders Mindset” coaching experts. You can learn more about his important books such as “The Disciplined Trader” and “Trading in the Zone” by doing a search on Amazon.com 

I suggest to traders that these two books should be required reading in order to advance your career and be successful.

So I hope that based on the above information I have established some credibility in your mind so that when I show you the following indicators and charts you will trust me enough to watch the short video that I have presented here on this important trading approach I use.

For trading consistency you will find that “Volume and Price are the two real elements of day trading futures.

It is well known by experienced traders that the Volume will generally lead the price movement of the market you are trading.

So it only stands to reason that IF you could detect a shift in volume with extreme accuracy you could potentially detect when the price is going to change in advance of the move.

Please read carefully again what I just said above.  It is one of the most important aspects of understanding how to trade on the right side of the market.

What we are really attempting to do in futures day trading is to “read into the future” of the price over a very short period of time. In other words in a humorous sense we are trying to become a “Junior Nostradamus” literally every day and indeed every moment while we are trading.

To accomplish this I have developed two very specific indicators I call VOLMO (Volume Momentum) and PRIMO (Price Momentum).

These are very inexpensive indicators in line with my long time policy of NOT gouging traders for any of the services or indicators that I offer.

We also have our long time (10 years on the market) highly successful proven software which is used by thousands of traders known as Boomerang Day Trader. Even though we have had thousands of traders make on going successful trades with Boomerang I have not raised the price.

You can acquire the individual VOLMO and PRIMO indicators and/or Boomerang separately or together. Either way you will see greatly increased clarity in your futures day trading.

Here is a chart showing VOLMO -Volume Moving average- on a plain chart. After you study this chart please watch the short video here I have presented which shows VOLMO and PRIMO on a Boomerang Day Trader chart.

I have written notes on this chart showing where the Volume Momentum line shifts color (bias) and how that is followed by a reversal of price. We then see a histogram color change showing additional momentum strength in the subsequent price movement in that direction, then we can expect the price to follow.

Now please take a few minutes and watch this brief video below which shows how to correlate the Volume momentum shift with the Price momentum shift on my Boomerang Day Trader chart. Note how Boomerang Day Trader gives you exact, crystal clear entries on the trades.

For more information on the VOLMO and PRIMO indicators which are only $195 each, click here.

Frankly, I am showing you the real keys to finding extremely high probability trade setups AND achieving consistency in your trading.

The VOLMO and PRIMO have been my “secret weapons” for many, many years and have been developed with time, experience and literally thousands of live trades.

I just recently released PRIMO and VOLMO to the public at an extremely low cost to assist traders in speeding up their learning curve. These indicators are exclusively used on NinjaTrader. (www.ninjatrader.com)

Even if you decide not to purchase these indicators that I have developed, then point your research and focus towards Price and Volume which will speed up your journey to success in futures trading.

High Probability Trades are discovered by matching the underlying bias with the surface bias.

In your research you will clearly discover that to find the highest winning ratio of trades you will want to learn how to read the underlying bias of the market. 

I consider this to be what I call the “Helicopter view” of the markets.  This can be read in several ways but it requires an in depth study to learn.

I have prepared a special article specifically on how to read the surface and helicopter view of the market which you can study here:

https://www.daytradersaction.com/how-to-read-the-market-like-a-book/

When you learn to read with extreme precision the surface bias of the market and you trade on that side of the market in line with the underlying bias then you are on your way to steadiness and consistency in trading.

THE SPECIAL OFFER

My Boomerang Day Trader software performs these functions for you along with your discretion of learning how to use the software with the exact, specific rules. These rules are easy to learn and we go over them on our regular Boomerang training webinars many of which are recorded on our blot at:  www.boomerangtrader.com

In addition, Boomerang Day Trader gives you exact, crystal clear profitable entries and exits in the futures market unlike ever seen in the industry before.

Boomerang Day Trader has been one of the most popular day trading software in the community for almost 10 years now delivering consistent 80-90% winning trade signals.

You can learn more about Boomerang Day Trader by going to our website which, as mentioned, offers FREE bi weekly training classes  which you can attend before you purchase.

Purchase Boomerang Day Trader here and make up to 90% winning trade signals.

Boomerang Day Trader is only $1195 and will consistently give you up to 90% winning trade signals coming from the software following our exact, proven method. 

Boomerang comes with our regular bi weekly training classes so you are always kept up to date on the markets and how to trade them with Boomerang.

ABOUT THE AUTHOR

Author: Mohan Wolfe
Company: Mohan's Day Trader's Action
Website: DayTradersAction.com
Services Offered: Trading Education,  Software, Trade Alerts
Markets Covered: Futures, e-minis

Mohan is a 25+ year trading veteran and trading coach for over 15 years in the industry. He is also the developer of Boomerang Day Trader, which is one of the top selling day trading software on NinjaTrader.​

Chapter
08

Using Multi Time Frame Analysis to Trade Crude Oil Futures

By Mark Sachs, RightLineTrading.com

Traders utilizing indicators to help locate precision entries are in a position of great uncertainty. Most are unsure of which indicators to use and unsure if the indicator analysis lags price or leads price. If the analysis lags price then it provides no predictive information as to where price will move out into the future. Any entry signal that this analysis creates will point to a high-risk entry that is likely to fail.

The forces that moves price are order-flow, momentum and stochastic. All of our analyses ignore price movement on the trading chart and looks at the 2 longer term time frame charts only. For example, if you trade a 3-minute chart the order-flow analysis, stochastic analysis and momentum analysis are taken from the 9-minute and 27-minute charts with the results utilized on your trading chart. When order-flow, momentum and stochastic align to the downside or upside on these longer term time frame charts then price on you trading chart will move in that direction: this is known as the “Triple Screen Method”. To see exactly how we formulate this analysis I provide you with a detailed explanation in my video.

Watch our video and see how the multi-time frame analysis of Crude Oil provides us with low-risk high-reward trade entries.

THE MOVIE: USING MULTI TIME FRAME ANALYSIS TO TRADE CRUDE OIL FUTURES


THE SPECIAL OFFER

Get my RLT Uni Renko Three line Trading System Here!

Take Low Risk, High-Reward Trades only. This System will drastically change your trading performance. Its easy to use and comes with a visual/audible alert.
 

ABOUT THE AUTHOR

Author: Mark Sachs, Founder & CEO
Company: Right Line Trading
Website: RightLineTrading.com
Services Offered: Trading Education, Live Trading Room, Indicators
Markets Covered: Futures (Crude Oil, eminis)

Mark Sachs is a former professor at Jefferson College in Philadelphia who did his thesis on the optimization of multi-variable equations utilizing computer generated search algorithms. He has applied his knowledge and experience to the movement of price in the equities market.

Chapter
09

TRADING VOLATILITY UNDER THE TRUMP MARKET

By Matt Buckley, TopGunOptions.com

My name is Matthew 'Whiz' Buckley, the founder & CEO of Top Gun Options. Unlike 2017, volatility has returned with a vengeance for the first 2 months of 2018.

If you don't know what strategic and operational events cause volatility to spike and slam, or how to trade these swings - it's going to be a very long year for you and your portfolio. In this Urgent Alert I introduce an options TACTIC (not a strategy) that will potentially see significant profit as the market stabilizes and rally's after the recent Putin, Powell, & Trump market shocks.

To take a 2 week test flight into one of our live trading briefs and alerts services head to www.topgunoptions.com and scroll down to select your experience level.

Trading is a form of combat. Someone is going to win and someone is going to lose.

At Top Gun Options we'll put you on the right side of that trade.

Fight's On!

Whiz

THE MOVIE: TRADING VOLATILITY UNDER THE TRUMP MARKET

THE SPECIAL OFFER

To take a 2-week test flight and check out the 4 portfolios Whiz manages from Weekly Options to Accelerated Retirement follow this link.

Click Here for a 2-Week Test Flight!

Whiz produces a daily market SITREP (situation report) which covers his take on the markets and world events along with potential actionable trades.

ABOUT THE AUTHOR

Author: Matthew “Whiz” Buckley, Founder
Company: Top Gun Options
Website: TopGunOptions.com
Services Offered: Trading Courses, Mentorship, Trade Alerts
Markets Covered: Stocks, Options

Whiz is a highly experienced financial business executive, and decorated Naval Aviator who graduated from Naval Fighter Weapons School (“TOPGUN”).