Volatility! Bad? Most investment advisors steer investors away from volatile stocks or any volatile trading entity. But for the candlestick investor, volatility is extremely profitable. Candlestick signals are based upon a very simple premise. The signals are formed based upon the change of investor sentiment. This allows for accurate evaluations of price movements whether a trading entity is slow or steady as well as volatile price action. When you hear a money manager tell you that you cannot time the markets, get away as soon as possible. That money manager does not know how to time the markets.
The use of candlestick analysis not only exploits volatile profitable trades, it allows for identifying when a very volatile/profitable trade set up is occurring. There are candlestick patterns that produce high probability strong price move results. Candlestick analysis is the graphic depiction of what is occurring in human nature. It’s accuracy is based upon hundreds of years of observations and utilization from Japanese Rice traders. The reason they work so effectively is due to the fact that investor sentiment reacts the same way time after time. This is what makes volatility in price movements much more beneficial when utilizing candlestick signals and patterns.
If you are spending time and energy investing, an investor wants the best results for the time spent. Because of the accuracy of candlestick charts, logic dictates the signals should be utilized in trading set ups that are going to produce the best returns. The more volatile a price movement, after establishing a position using candlestick signals, the much better prospects for producing large profits.
Trend channels produce a very powerful trading technique for exploiting volatile price moves. They are very visible, which makes them easy to utilize even for the inexperienced investor. Simple trend lines allow for the establishment of these highly profitable visual indicators. Trend channels themselves can produce very high probability results. Adding the visual aspects of candlestick signals allows investors to even see more clearly when it is time to buy and when it is time to sell.
Defining a channel
The development of a trend channel is simple. They can be created in four simple steps.
1. Identifying a high point and a low point provides the initiation of a prospective channel.
2. Witnessing another high point or low point creates the structure of a channel.
3. Drawing a trend line through two consecutive high points or low points now forms one level of the channel.
4. Drawing a parallel line through the other end of the trading range, the opposite high or low point allows for the extrapolation of the next support or resistance level.
Once a trend channel has been seen to be developing, utilizing candlestick signals make it that much more accurate as far as entering and exiting trades. The magnitude of the price move, the volatility, can be easily assessed when identifying the next potential support or resistance level.
There are simple visual elements associated with a trend channel. Prices usually move in waves. The Elliott wave trading strategy is not necessarily the most accurate or definitive method for producing investment profits. However, Elliott wave trading demonstrated a very important point. Prices usually move in waves! Understanding that concept allows investors to take advantage of techniques that utilize wave movement. Trend channels have very defining tops and bottoms, created by price waves. The direction of a trend channel can easily be visualized.
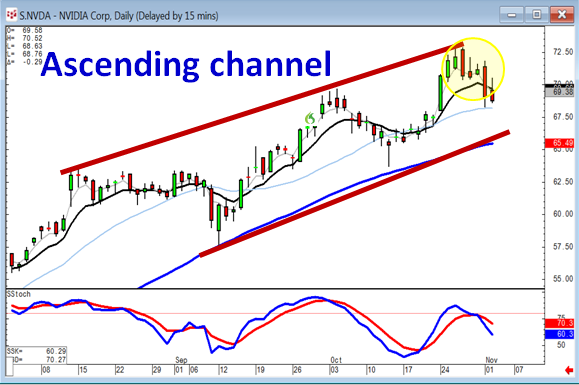
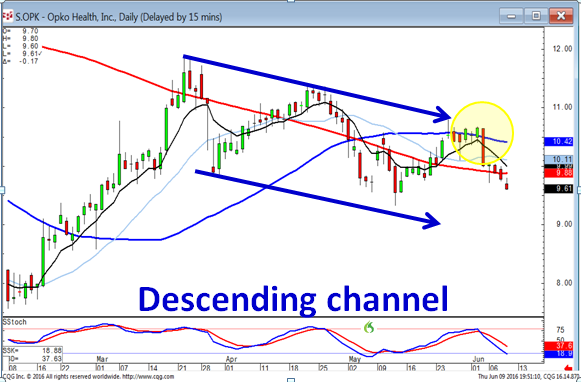
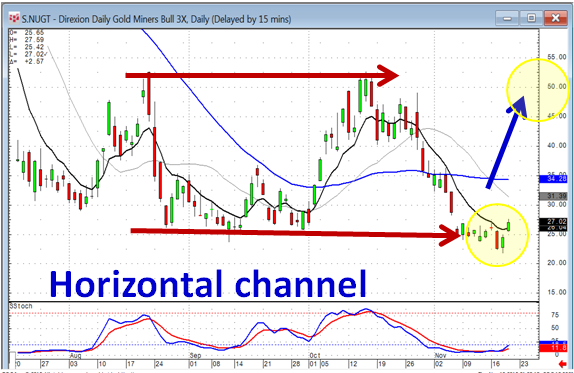
Calculating the magnitude of the volatility of a trend channel can be done easily on a visual basis. As a channel is developing, establishing long positions or short positions will usually be traded based upon what current candlestick buy or sell signals are demonstrating. It is when two tops or two bottoms can be identified that will alert the investor that a new trend channel may be in the making. It is when candlestick sell signals showed a reversal at the top for the a second time that the prospect of a channel was occurring.
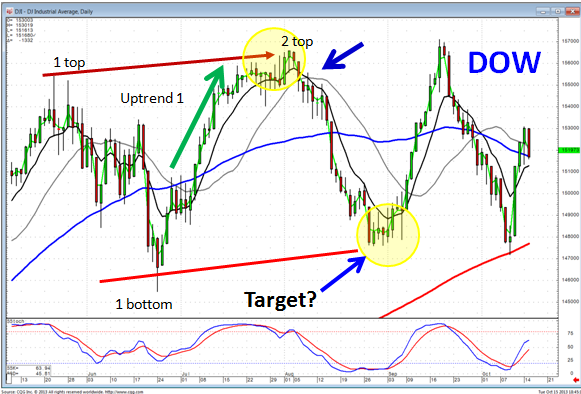
As illustrated in the Dow chart, there would not have been any suspicion of a trend channel until candlestick sell signals were witnessed at 2top. The downtrend from 1top to 1bottom would merely have been analyzed as a downtrend. 1bottom showed the reversal with a Bullish Harami. The uptrend would have incorporated the normal candlestick analysis. What was the first likely target? The 50 day moving average. Then the bobble/J-hook pattern breakout occurring at the 50 day moving average provided the strong indication an uptrend would continue. Where was the target of the uptrend? More than likely the test of the recent high established by 1top. The candlestick signals and a close below the T line just slightly above 1top formed 2top. Stochastics started rolling over in the overbought conditions. This is now creating the prospects of another downtrend. Being able to assess the volatility/magnitude of the next price movement becomes a valuable function for deciding whether that trade is worth the risk/reward.
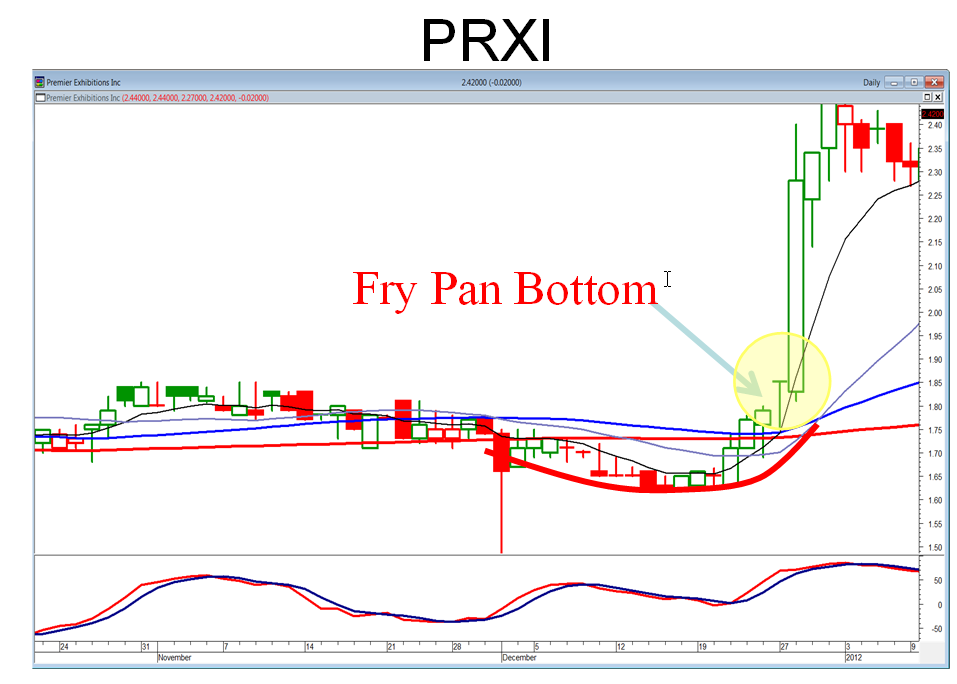
Candlestick analysis provides a major benefit for exploiting volatile price moves. Candlestick signals illustrate what is occurring in individual daily/specific time frame investor sentiment. Utilizing that information, the candlestick investor can get prepared for candlestick pattern results. Candlestick patterns are recognized because they do produce high volatility price moves. As illustrated in the PRXI chart, the Fry Pan Bottom pattern has expected results. A huge bullish price move when it breaks out.
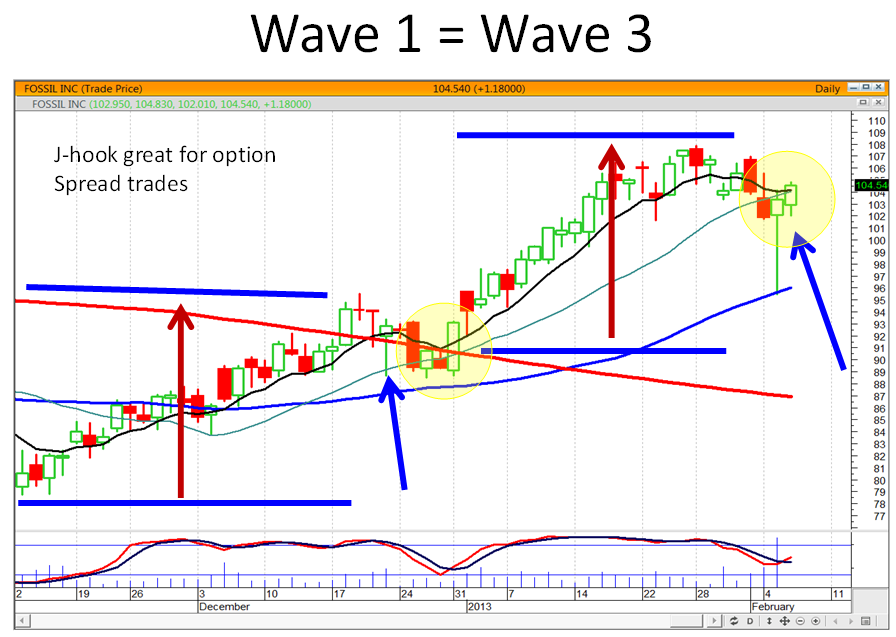
The J-hook pattern produces a very high probability result. Wave one is usually created by a strong/volatile bullish move. Wave two is created by an indecisive pullback. When the candlestick signals reveal the pullback is over, wave three can be calculated to be the same magnitude as wave one. This provides a huge benefit to the candlestick investor. Not only is the direction of the next move highly probable, but the magnitude of the move can easily be calculated. Wave three will usually be the same magnitude as wave one. Because those probabilities are extremely high, the more volatile the price move of wave one, the more profitable for establishing a position as wave three commences.
J-hook Pattern
Volatility is good!
There is a very simple rule on Wall Street. If something doesn’t work, it disappears very quickly. Candlestick analysis has been around for hundreds of years. It doesn’t have to be promoted as a new secret trading strategy. It is merely common sense investing practices put into a graphic depiction. Because candlestick signals and patterns produce extremely high probability results, it allows investors to accurately assess what is occurring in high volatility price movements.


