While there are a number of continuation patterns in trading, the J-Hook Continuation Pattern is one that is a very decisive and can be easily identified since it forms the letter J. If the chart pattern is followed, entered at the right time and unfolds as expected, it can be very profitable. J-Hooks may also called by other names like Thunderbolts and 123 formations.
There are three basic parts to the pattern 1) a strong upward move in price 2) a pullback and 3) an up move which should continue into a breakout above the previous pivot high in price to complete the pattern and continue the uptrend. Figure 1 presents the three price movements that take place as a J-Hook develops.
1. Price moves rapidly with a strong upward move in price.
2. Price begins to pull back forming a small cup that is its signature move during the J-Hook pattern development. The pullback can be divided into three parts as follows:
– Price begins to pullback with lower highs, which is the start of J-Hook formation.
– Price establishes a low with several candles, possibly close to a support line.
– Price moves up toward the previous high and can meet resistance at this point.
– Price breaks out above the previous high to continue the uptrend in price.
.jpg)
Figure 1: The three sections of a J-Hook Continuation Pattern
J-Hooks are very easily spotted once the pattern is learned. There are no hard and fast rules about the exact shape and minimum number of days for each candle to reside in the three separate phases of the J-Hook Pattern. Rarely will you see a perfect J-Hook and continuation move up that goes in a straight line. There are some patterns that can be confused with J-Hooks as not all patterns are as clear and concise as the model depicts. Study the charts that follow:
Valeant Pharmaceuticals (VRX) shows a relatively clear and easily identifiable J-Hook chart pattern in Figure 2.
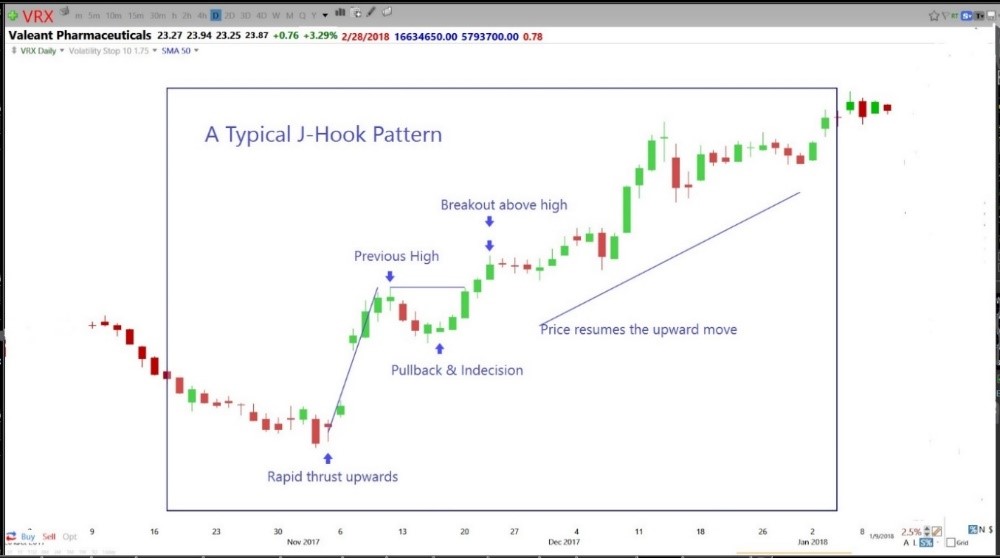
Figure 2: A completed J-Hook Continuation Pattern showing price movement
U.S. Steel Corporation (X) chart shows a much longer uptrend and a deeper pullback in Figure 3.
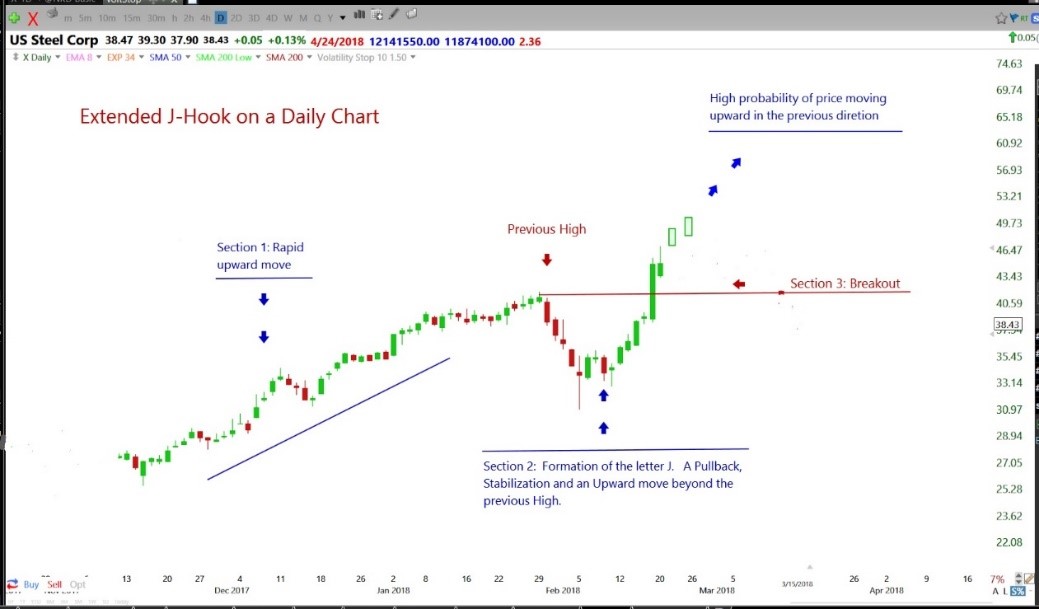
Figure 3: A Deep and Extended J-Hook
Twitter Inc (TWTR) in Figure 4 has formed a J-Hook with an upward thrust that diverts from the normal accepted path of a J-Hook at two different times. It pulls out of the upward trend for about three days and then resumes its ascent until it starts to pull back forming a cup shaped structure. Price has moved above the previous high with a possibility of moving up.
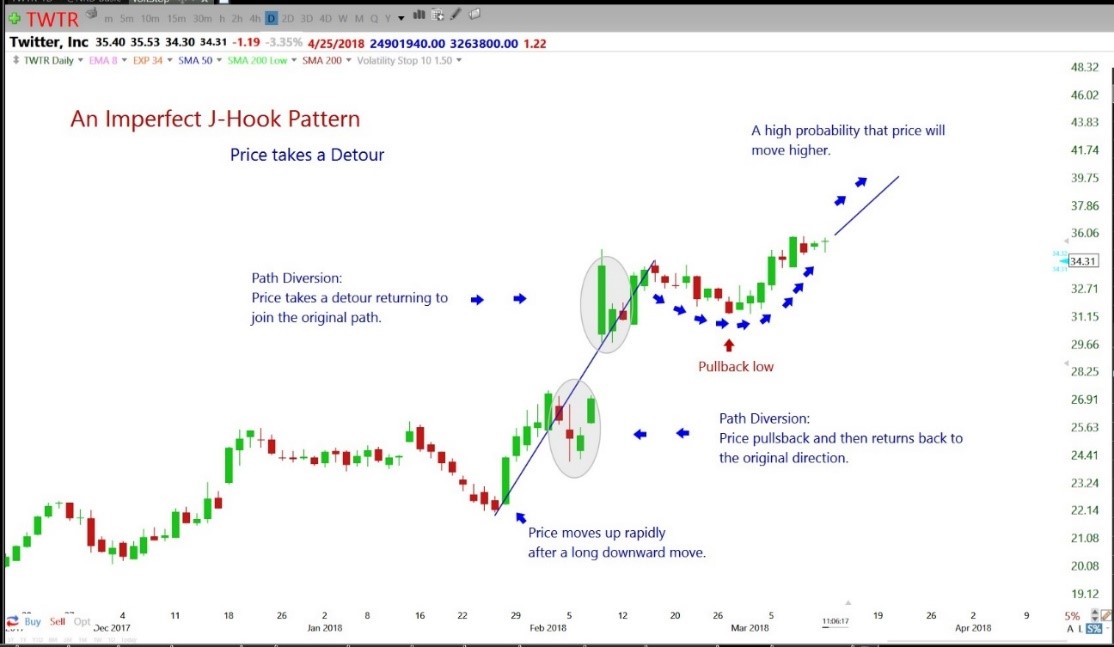
Figure 4: A J-Hook that deviates from its upward path.
The J-Hook Continuation Pattern provides no guarantee that price will move into the high probability zone, no matter how perfect the configuration. The chart on X in Figure 3 is an example of a very clear J-Hook but may be too deep and extended for some traders while acceptable to others. The same is true of Figure 4 where not all traders would be willing to accept the pattern as a J-Hook.
Progression of a J-Hook
The following movements in a chart pattern are a must for it to be called a J-Hook.
1. Price action shows a strong upward trend in progress.
2. As sellers begin to take profits at the pivot high of this move up, the upward move is interrupted causing price to pullback.
3. As the selling process slows down it reaches a low point, a place of consolidation (the bottom of the cup).
4. Price action begins to turn up and move higher as buyers begin to purchase, confirming that the pullback is over.
5. Price action moves in an upward direction again and, as price breaks out above the prior pivot high, it continues to move in the upward direction completing the J-Hook Continuation Pattern.
In the Red Hat Inc. (RHT) chart below, Figure 5, it is in an uptrend, but will pullback or reverse the trend when sellers enter the scenario.
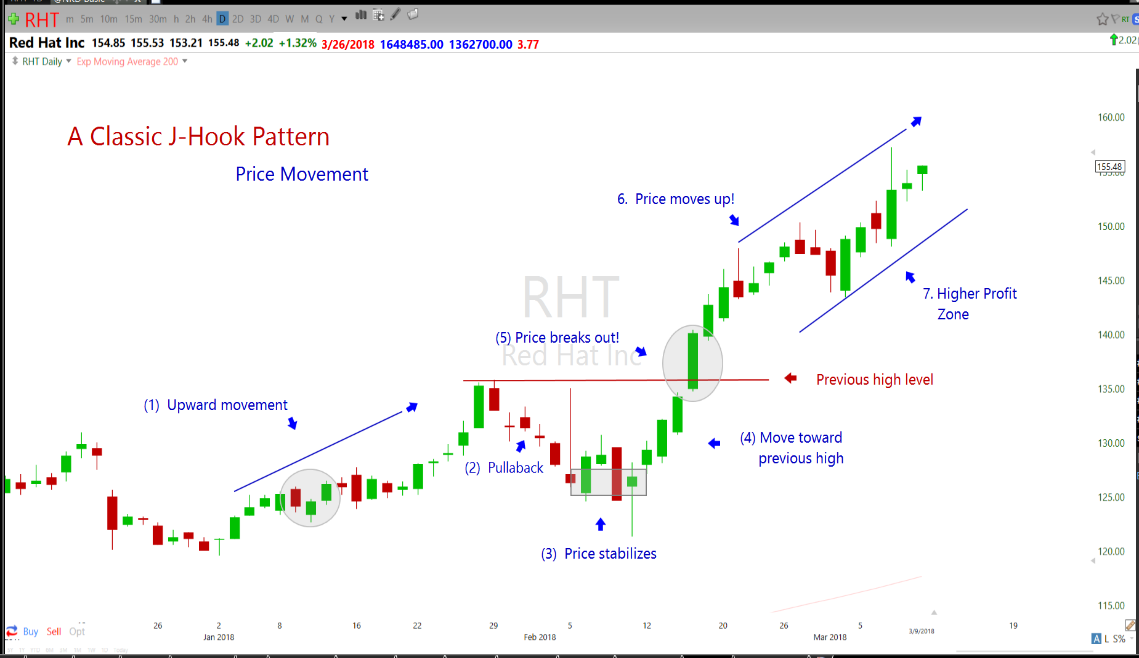
Figure 5: J-Hook Pattern and Price Movement into the High profit zone.
The key to recognizing a J-Hook Continuation Pattern is not just the initial upward move in price, but also the patterns that preceded the move. The greater the number of positive signals prior to the J-Hook formation, the stronger the probability of an upward swing. The pattern becomes more forceful if the initial move up appears after a Morning Star or Bullish Engulfing Candlestick Pattern, a double bottom, and other positive signals and patterns. See Figure 6 below.
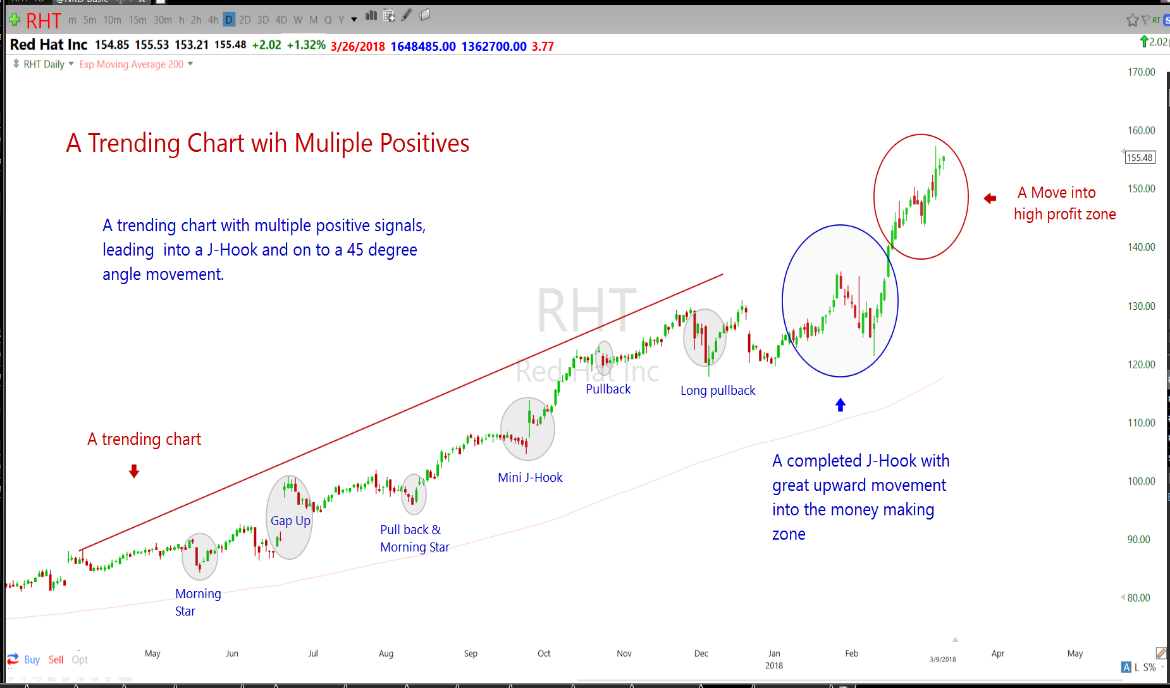
Figure 6: Longer term chart pattern shows multiple positive conditions leading up to the J-Hook
Sometimes J-Hooks form above the support line with the pullback testing support. When this happens consider it an added strength that raises the probability of a move higher. This may take it further into a higher probability zone; if the pattern works out, it may offer more than the expected gain. See Figure 7 on RHT below.
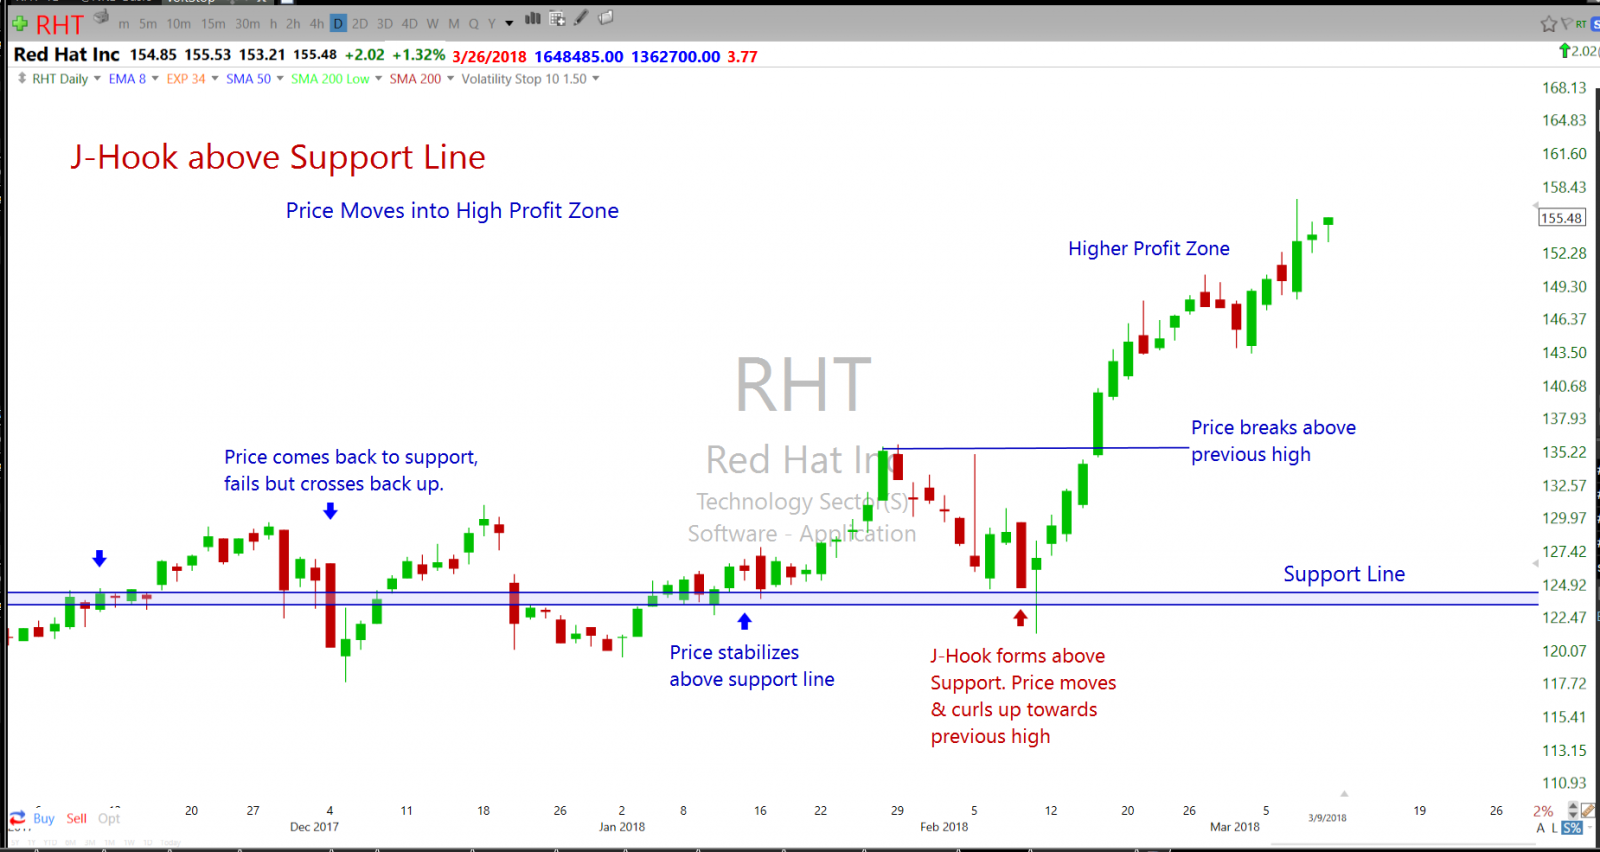
Figure 7: J-Hook forms with a pullback to the support lines
Using Different Time Frame Charts
We all want charts to move up in a steady straight line, but that does not always happen and price will pullback providing another buying opportunity. The back and forth movement can compromise the clarity we expect to observe. Many times, on a daily chart, this price action will make the underlying chart formation harder to recognize.
I have, personally, found it more successful to use the Daily Chart. However, a 2-day or 3-day chart may offer a clearer picture by eliminating indecisive candles and providing a better understanding of the underlying price action. Your reason for looking at longer time frames may range from being a longer-term trader or eliminating the noise on a lower time frame.
If used correctly, there are the advantages of using various time frames:
1. A cleaner picture of what is happening to price action as it moves.
2. Support and resistance may be seen that is not evident on a daily chart.
3. Recognizing a pattern that may not be obvious at first glance on a daily chart.
Compare the Extended J-Hook daily chart on X in Figure 8 to a 3-day chart in Figure 9 and see how it displays clarity and is easier to observe. A great reason for checking out multi-day charts is to get a cleaner picture of price action that is easier to observe and understand.

Figure 8: An Extended J-Hook on a Daily chart of X
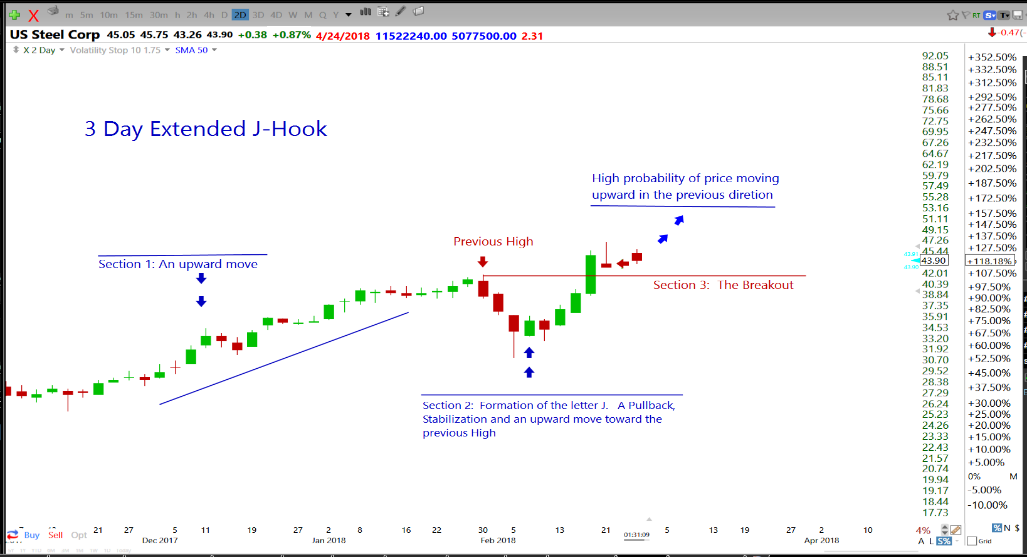
Figure 9: A J-Hook 3-day chart of X eliminates noise
Entering a J-Hook Trade
The J-Hook Continuation Pattern is a move upward in price, a pullback and a continuation of the movement in the original upward direction as described in the sections above.
There are four suggested areas for entering J-Hook trades. It is always important to know that profit is not made while the pattern is in progress, but after it completes and signals that buyers are stepping in and price resumes its upward movement. This does not mean that shorter term trades within the pattern are not possible. Swing traders may prefer to enter the trade as the pattern develops. The four entry areas are listed below. See Figure10.
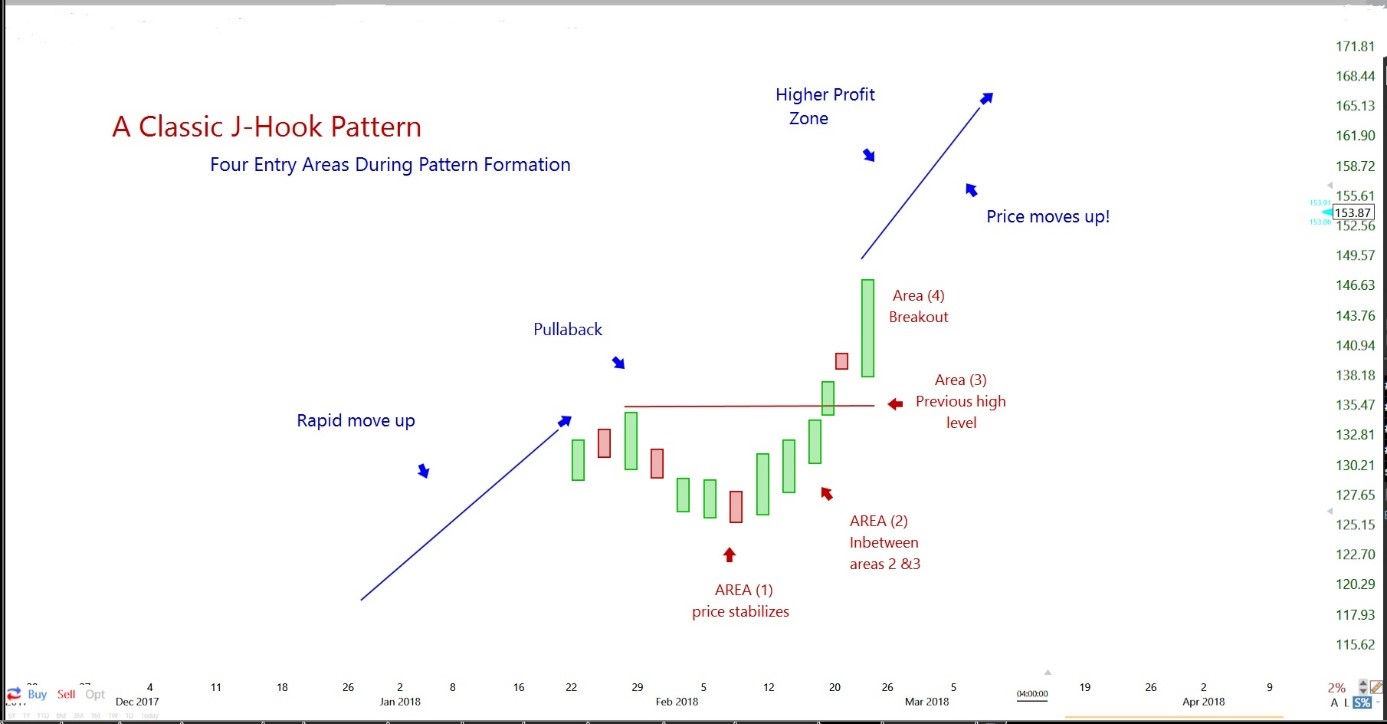
Figure 10: Four places to enter the J-Hook Continuation Pattern
Area 1: Price reaches a low and consolidates with a higher low or a candlestick buy signal
Area 2: Price is between Areas 1 and 3 where buyers can enter.
Area 3: Price reaches the same level as the previous high.
Area 4: Price breaks out, moving toward a new high, continuing in the original upward direction.
It is important to note that no one area is better for entry than the other. Where you designate your entry point is a matter of personal preference. If you chose to enter at Areas 1 and 2, the probability is that you are not planning a very long-term trade. You may want to get out at the first swing, which could be an exit at the resistance line, when price reaches the previous high. On the other hand, if you can manage the trade all the way up for a bigger percentage gain, Area 4 may be your personal choice. The larger profit is usually made after the chart pattern has completed. Your entry and exits should be planned with stops to preserve capital.
As a student of the Market, you may ask the question, “What should I do?” The answer is “Be vigilant” and train your eyes to follow the chart and determine if the probability of success exists. Remember the importance of being aware of the possibility of a J-Hook forming before, during formation, and after it has formed. When you see the possibilities, it becomes a watch list candidate. It will give you opportunities of entering the trade in Areas 1-4 as it moves along. Some words of advice once again are, “Make sure you trade with a plan in place.”
All J-Hooks have an initial move up in price; however, it is unknown whether it will turn into a J-Hook as it moves. At some point price it will start to pullback, bottom out, and turn up moving toward the previous high. If it fails to do so and breaks a support line, it is no longer a J-Hook.
A good way to estimate the pullback in price action is to use the Fibonacci retracement lines. Draw the Fibonacci lines on the initial upward move of the chart and determine if any of the retracement lines coincide with the lowest area of the pullback. You can use the following as a guide to estimate the progress of the pattern as a J-Hook.
1. A 23.6% retracement line is my favorite for this pullback.
2. Between 23.6% and 38.2% retracement, the area can still be a good entry section.
3. Below 38.2% is a gray area to be entered with a lot of caution.
4. Below 50% the chart pattern can no longer be placed in the J-Hook category. Due to such a deep pullback, it pulls price out of the short-term swing trade range.
Check out the Sandridge Miss Trust II (SDR) chart Figure 11 below; at first glance it appears to be a great J-Hook, but price continued to move below 50.0 % and far beyond. The blue arrows show an ideal formation of a J-Hook chart pattern.
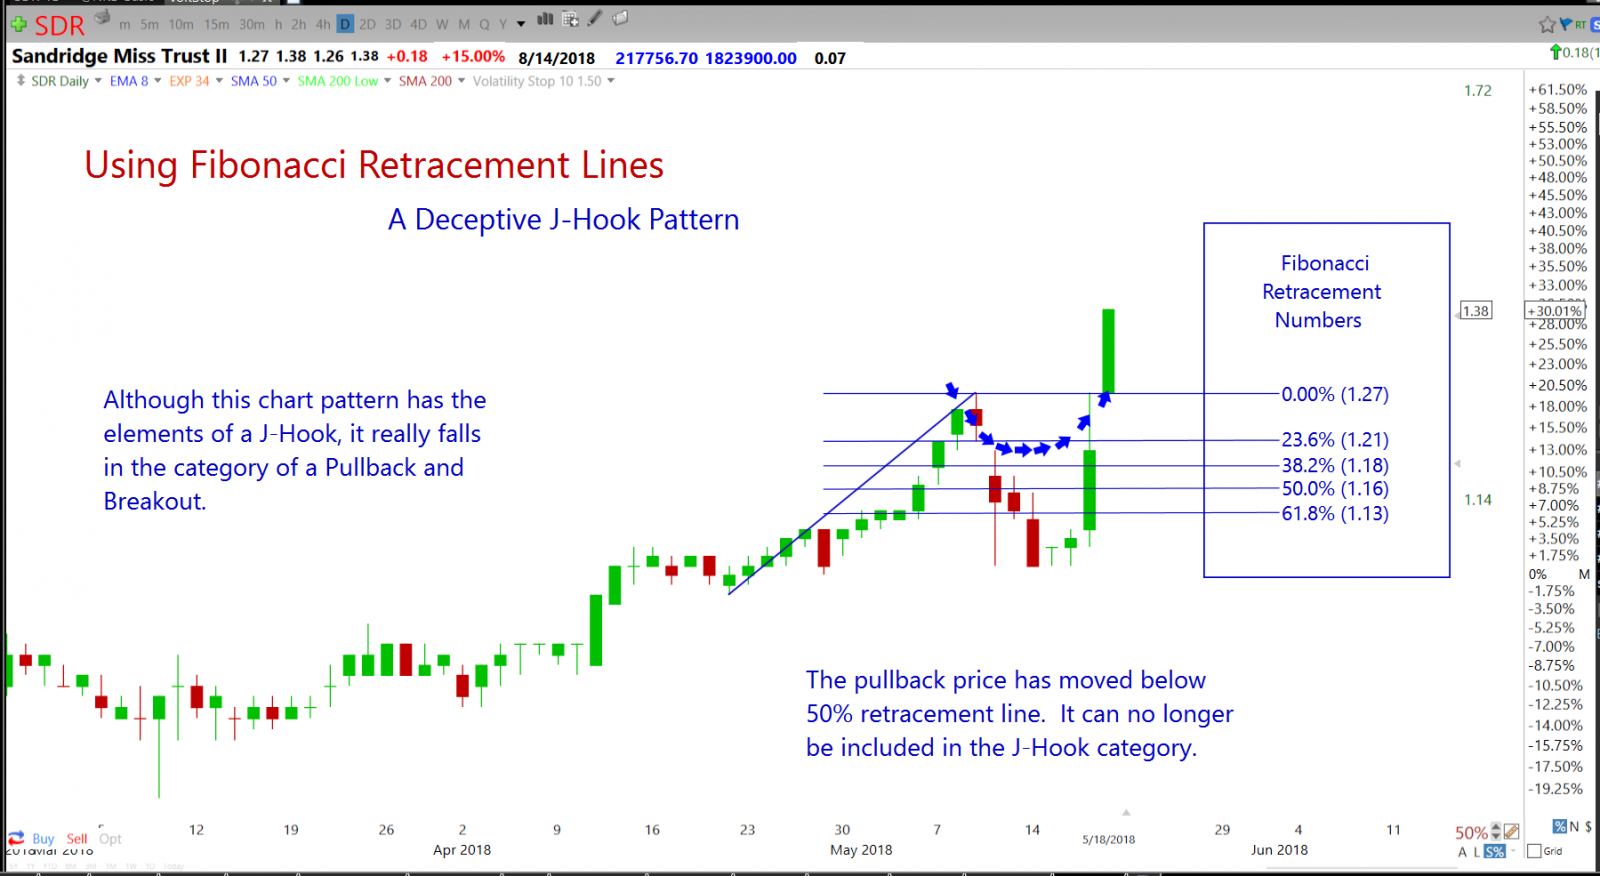
Figure 11: A deceptive J-Hook that ends up as a four-candle pullback.
There are no guarantees that a chart pattern will succeed or fail with the use of Fibonacci retracement lines. It may not fully develop into a J-Hook but if the upward trend has not broken, it may still be worthy of keeping its position on a watch list.
Many high probability trades are missed because of what we think are “chart pattern failures,” so we, as traders, “fail the chart.” We simply neglect to follow the chart and keep it on our watchlist.
Observing Failed J-Hooks
All charts can fail at any stage of the J-Hook formation before or right after the pattern completes.
You may anticipate the development of a J-Hook on a chart that shows promise, but it may not materialize and ends up with a failing reversal pattern. It can also reach the previous high and form a double top or reverse at any point and no longer reach the profit zone. The Sprouts Farmers Market (SFM) chart shows a J-Hook that failed prior to reaching the previous high. See Figure 12 below.
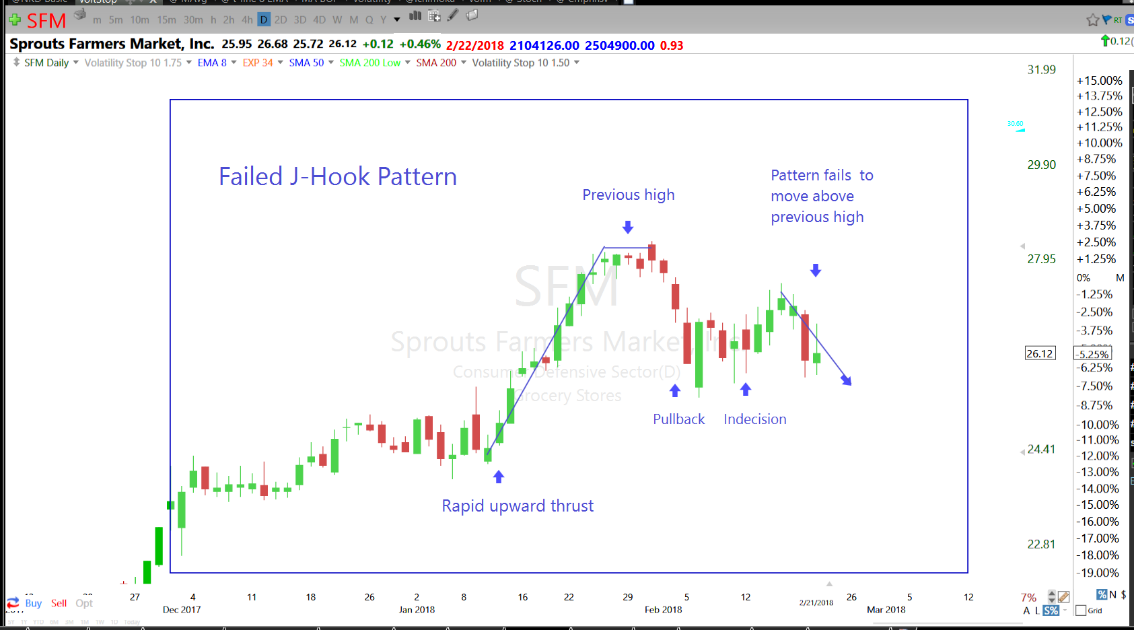
Figure 12: A Pattern that failed to complete the J-Hook and enter the higher profit zone.
In the US Steel Corp (X) Figure 13 below, the J-Hook failed to move up very far after the breakout even though the chart pattern is still above the bullish trendline.
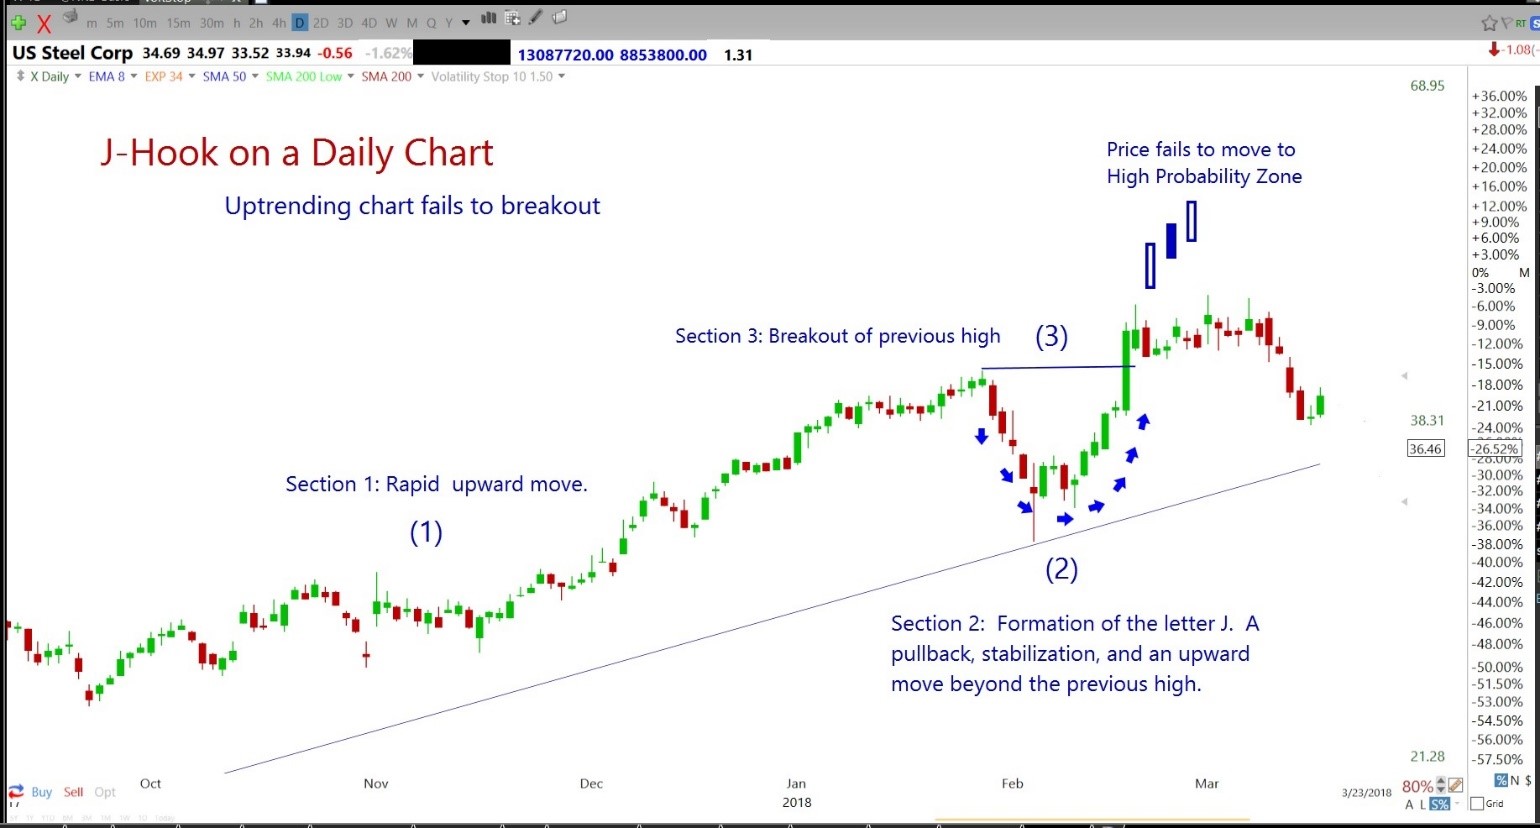
Figure 13: A chart pattern that failed to complete the J-Hook and enter the higher profit zone.
As traders we need to keep in mind that “patience is the name of the game.” Most of the time we give up on a failed chart pattern if it pulls back more than what our plan dictates, and we spend too much time regretting and dubbing it as a “failure.” There are hundreds of charts that can be found even in a down trending market. If you are a struggling trader, it is always best to trade with the trend of the market and not against it.
In Summary
The J-Hook Continuation Pattern is one that I have personally traded for many years. It takes time to become familiar with the pattern and understand the price movements within the pattern that have proven to be most successful over the years. The details of the J-Hook Continuation Pattern that are shared in this write up are what I have found worked best for success. I wish you great success as you learn these details and incorporate them into your own trading program.