There are many ways to trade options or use options in trading. Many people trade options for the sole reason that they are much cheaper than trading stock. It is kind of interesting that it is rare to find an options trader that would ever buy a stock, or a stock trader that would ever buy an option. I believe that both camps are wrong. You need to be able to trade both, or at least take advantage of both. The reason for this is that if you trade stock, you can minimize risk and maximize gain using options. If you trade options, you do not get the full benefit of the stock’s move if you are right, and you run the risk of being assigned the stock, which scares options traders, and it shouldn’t. I’m not going to get into the fundamentals of options, but let’s digress for a paragraph or two to get some understanding before we talk about the strategy I want you to learn.
Buying is the opposite of selling. Long is the opposite of short. Bull is the opposite of bear. There are only two things that matter in options; if buying an option, it must go beyond strike (in the money) for you to be paid on expiration day, and if selling an option short, you can end up long or short the underlying stock at the strike price. If you keep these two things in perspective, your option trading will go a little smother.
If you buy a call option, you are buying a right, not an obligation, to purchase a stock at a specific price (the strike price) on or before a specified date. When buying a call option, you want the stock to go higher. If you buy a put option, you are buying the right, not the obligation, to sell a stock at a specified price on or before a specified date. When buying a put option, you want the stock to move lower. Now the opposite side. If you sell a call option (going short the option) then you are selling the right to buy to another party, and if they exercise their right to buy, you must sell to them (you are taking on an obligation) and you could end up short the stock unless you already own at least 100 shares of it. Selling a call option when you do not own the stock is called a naked call, but if you own the stock it is a covered call. If you sell a put option, then you are selling the right to sell to another party, and if they exercise their right to sell, you must buy from then. If you are short the stock, you will buy it back (this is a covered put), but if you are not short the stock, then you could end up long the stock.
Now that we have that out of the way, let’s use these concepts to try and make a little money. Let’s make the assumption that we want to buy a stock. Let’s pick an expensive stock to prove a point and then we will look at a “normally priced” stock. Everyone has heard of Amazon, so we will start with it. Below is a daily chart of Amazon (AMZN). You can see back in January when its earnings came out. Notice since then that Amazon moves up to the 860 area and then back down to the 840 area. So let’s say we want to buy AMZN when it gets back down to 840. Now we can put a buy limit in, good till canceled, and wait for AMZN to sell back off and exercise our limit order. Then when it gets back up to 860, sell it and make $2000 for every 100 shares we buy. If we buy the stock, we will need to put a protective stop below 830 (notice that is when earnings came out), so we will risk about $1,000 to make $2,000. Nice trade, pat yourself on the back. Now let’s do it using options.
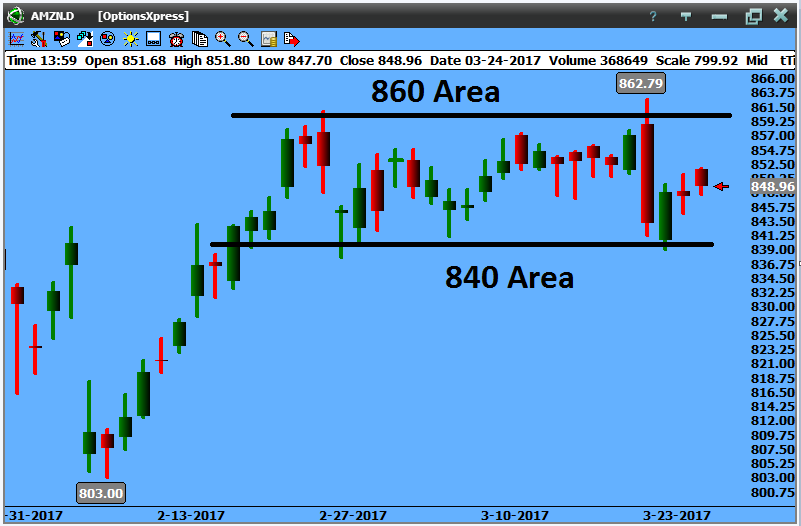
Daily AMZN Chart
Same trade with a twist. Instead of putting in a buy limit, let’s sell an 840 naked put option. Now this does two things: a) if AMZN gets to 840 or lower at expiration, you will end up long the stock (that is what is desired in this case), and b) by selling a put option, you will bring in money. In other words, the market is going to pay you to place a buy limit on a stock (that is pretty cool). Below is an option chain for AMZN. Based off the chart, AMZN is trading at 848.96, so AMZN is going to have to drop 9 points to exercise us. So it would probably be good to wait a while before selling the put to get more premium, but since we cannot put extended time in an article, we will use what we have (the concept is the same). Look at the 03/31/17 options. The 840 put is selling for around 4.10 (Last Trade). So if we put an order to sell at 4.10 and are filled, we will bring in $410 of credit. If by Mar 31, AMZN does not get to 840, we keep the $410 just for trying.
Note: if AMZN drops to 848 from 840, the put option will increase in value and your account will show that you are losing money on the option. This is not the case unless you buy it back at a loss. Remember the end game: you want to be long the stock from 840. AMZN will have to be below 835.90 for you to start to lose money (840 – 4.10 (premium brought in from the sold put) = 835.90). Let them exercise if they can, that is what we want.
If we get exercised, then we will put a stop below 830, around 829.89 (just below 830 by a little bit), risking $1,011. We will then sell an 860 covered call and probably get another 4.00 or so. So total premium brought in will be $810. If AMZN drops and stops us out, we will need to buy back the covered call (that now has turned into a naked call), but since AMZN has dropped, the call will decrease in value and we will probably be able to buy it back around 1.00 or so. So we get $700 in premium and lose $1,011 on the stock for a total of $311 loss. Now, if AMZN goes up, and we get called away at 860, we get $2,000 off the stock and $810 off the options for a total of $2,810. So in this case, we are risking $311 to make $2,810. Which scenario do you like best, a 1:2 risk/reward or a 1:9 risk reward? This is the luxury of options.
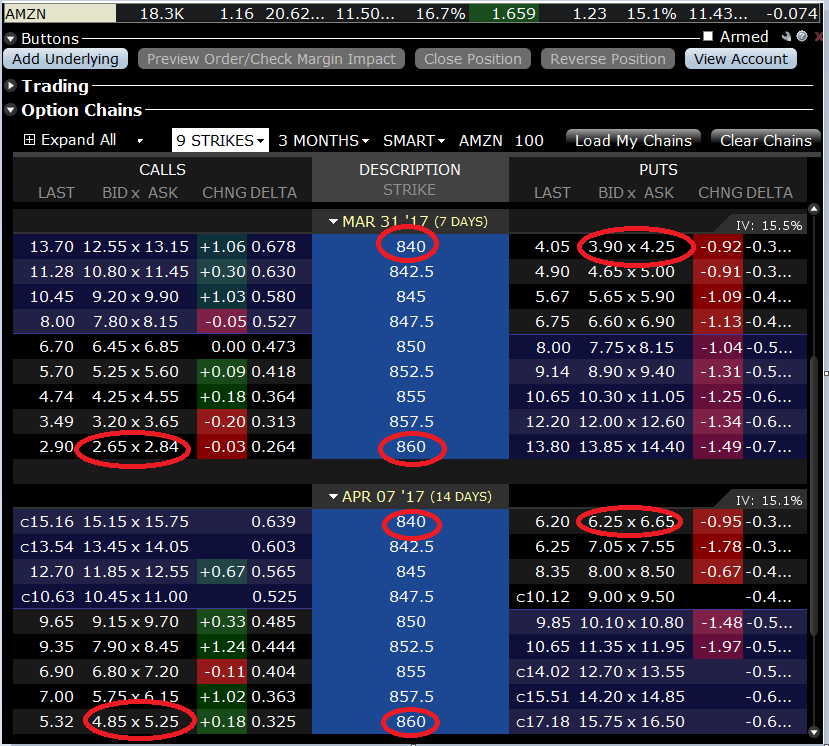
AMZN Option Chain
AMZN is a bit extreme since it is an expensive stock and is quite volatile. Let’s go to the blue chips and grab a stock like Caterpillar (CAT). Below is a daily chart of CAT. Notice it has support around 92 and resistance around 95. Next support is around 90.50, so we will use 90.19 for a stop if we get filled. Using the same technique let’s look at selling the 92 put. In the option chain below, the 92 put is going for around 0.80. Again, if it does not get there we get to keep the $80 and try again. If we get exercised, we place the protective stop at 90.19 and sell an Apr-covered call at 95 for around 1.21. There are weekly options on CAT, however, so we want to be able to finance the protective stop the best we can. By going out to the monthly option, we can get there. If we add the two options together (0 .80+1.21=2.01) we will bring in about 2.00. If we are long from 92 and need to risk to 90.19, we risk 1.81 on the stock. The premium we bring in will cover the protective stop. If we get stopped out, we buy back the short call and will probably lose around $25 or so depending on how much time is left in the option. If CAT moves up and we get called away at 95, we pick up $300 from the stock and $221 from the option premium for a total of $521. Again we can have the standard 1:2 ratio, but the 1:20 ratio of this trade seems much better.
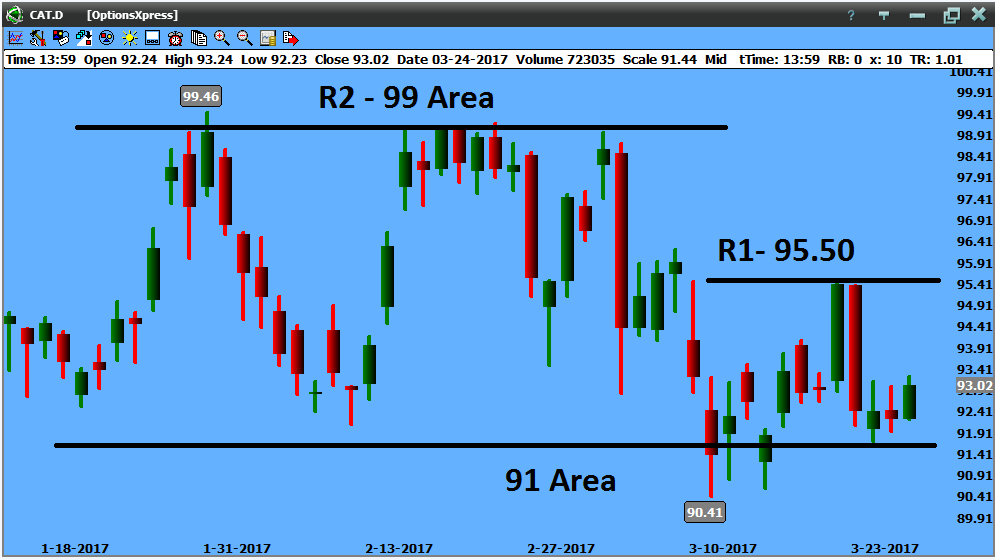
Daily CAT Chart
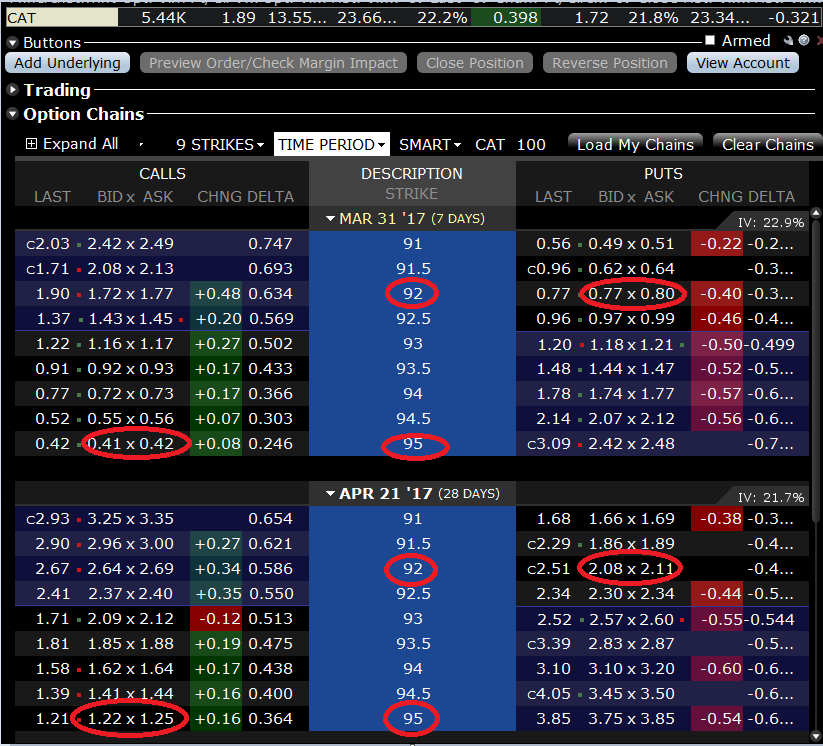
CAT Option Chain
We do have to throw the glass half empty theory in here since there are those who are pessimists and will ask, “what if CAT is at 85 when you get exercised, or what if AMZN is at 830 when you get exercised? What will you do then?” You’ve got to love those people. First, panic never solved anything so please get that out of your mind. But think about it very quickly. We did bring in premium when we sold the put, so we have reduced the risk somewhat. Next question is, if you just put a buy limit in and is sold off to that level, what would you normally do? You could sell a covered call at entry (90 on CAT or 830 on AMZN) and if you get called away, then you will make nothing on the stock but get to keep the premium from the options, still not losing anything. You could sell at the money calls and it will reduce your loss considerably, especially on AMZN but not as much on CAT.
Another thing, what if you end up long the stock, it does not stop you out, but is not called away from you? Even better in my opinion. You brought the money in from the naked put and the covered call, and now you get to sell another covered call. Before selling the same strike price, however, look at higher strikes. You may be able to get the same premium as before if the stock has moved higher.
There are many ways to scan for stocks. Many have their own favorite stocks that change over time. You will find some stocks that do not have options. I do not like stocks that don’t have options for the simple reason that I cannot minimize my risk and maximize my gain. The key is to trade stocks that have some volatility so that the option premium is higher. Coke (KO) has options but since the stock does not move much the option premium is low and therefore you cannot finance the protective stop. Below is a scan for stocks out of the DTI RoadMap™ software. It scans for optionable securities that are between $50 and$600, and are recommended buys/sells between Mar 23 and May 8 (it is sorted by highest P&L).
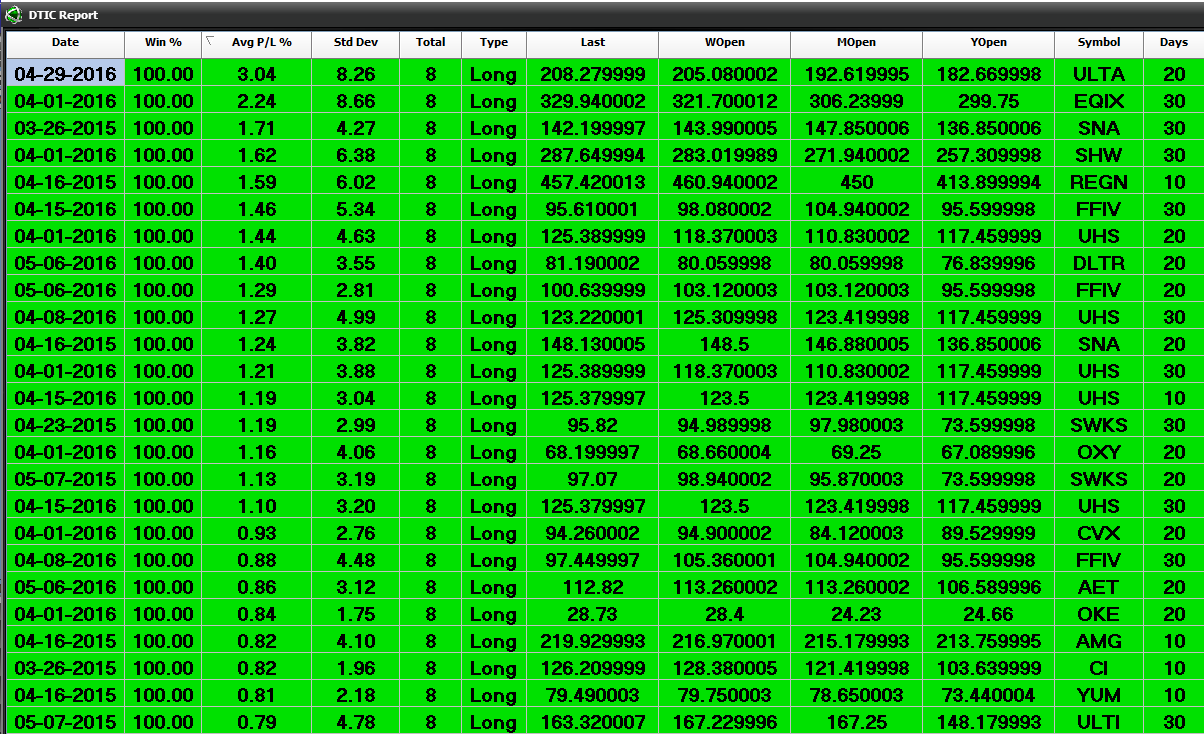
Starting in the middle to the end of April, stocks begin to move again after the “when in May go away” occurrence is over. Look at the Standard Deviation (Std Dev) column. The higher the standard deviation, the more volatile the stock. So I will look at these to see if they are trending with the overall markets. If so, they are prospects for trading.
Market direction is also important. You can do this same strategy on the short side as well. When markets are bearish, like we saw back in 2008-2009, many times selling calls do not get exercised. However, if they do, sell a covered put to use the premium to finance the stock.” But direction is important. First look at the year open, month open, and week open, and compare it to the current price of the stock. If the stock is above all three it is strong, if below all three it is weak. If it is between some of them then look at the indexes (S&P, Dow 30, NASDAQ) and see if they are doing the same. If they are, wait until a clearer picture can be seen. Below is a chart of the S&P and 3M. Notice on the left chart that the S&P is above the year, but not the month and week open. However, 3M is above the year open, month, and right at week open. If the market rallies from here, 3M would be a good candidate to sell puts on and see it runs faster. But the S&P will need to begin to rally and take out some resistance levels before doing that.
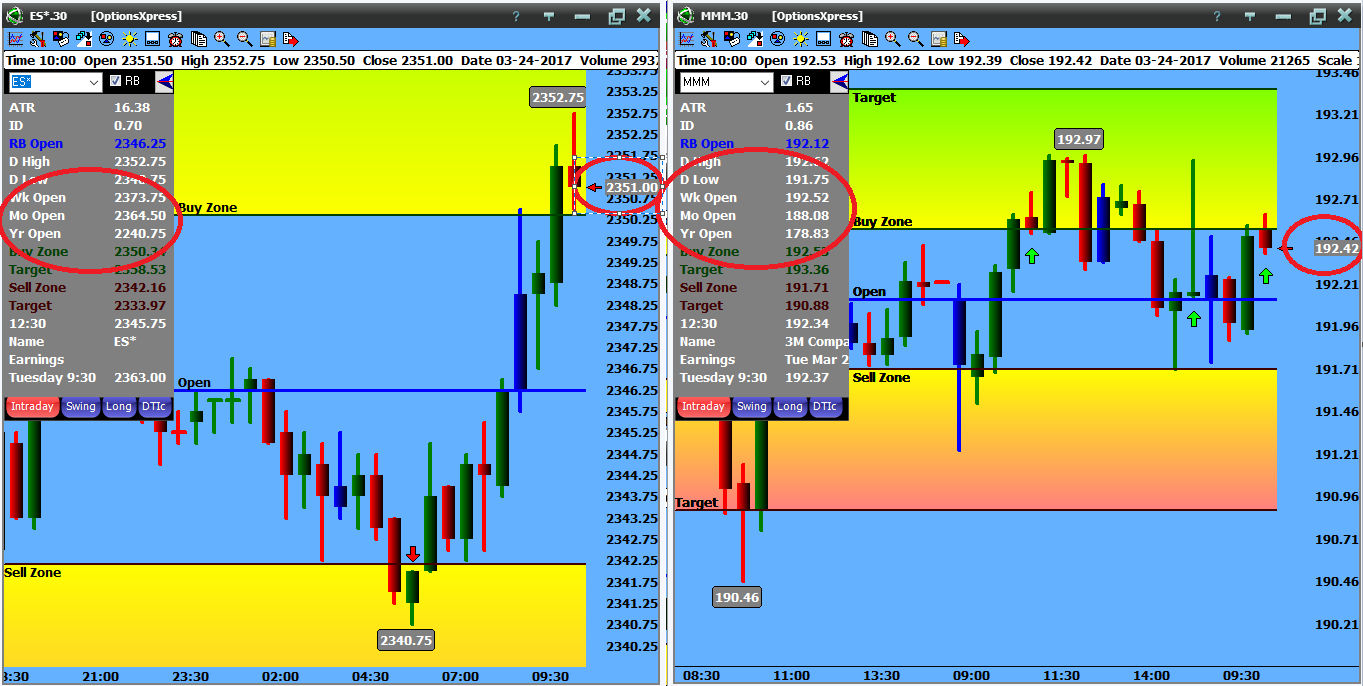
S&P and 3M chart
The same can be done for futures contracts if you have experience with them. I like using options on bonds to help pay for the utilities each month. Utilities — no one likes to pay for them, but they are necessary. To help pay for them, trading bond futures options seem to work well. Let’s discuss bond futures and their options a bit before we get to trading them. Bond futures are a commodity that trades in 1/32 increments and are worth $1,000 per point and $31.25 per tick (1,000/32 = 31.25). It controls a $100,000, 30-year US treasury bond. It is traded by the bond price, not the interest rate of the bond, though it is interest-rate sensitive. This means that if interest rates go higher, bond price goes lower, and if interest rates go lower, bond prices go higher. Bonds open at 17:00 and close at 16:00 CT. The price is displayed in decimal form or with a dash: 147.23, or 147-23, and sometimes 147’23. The 23 is in 32nd. So the price is 147 and 23/32. If you multiply that by 1,000, the bond is worth $147,718.75. Par value is $100,000, so in this case you would be paying a $47,718.75 premium. Economic news will affect bonds, as they look for inflationary (rising interest rates) or deflationary (falling interest rates) indications.
Options on bond futures trade in 64th increments. They trade as long as the bond futures are open and trading, so you can actually get out of your trade in the middle of the night, if need be. They are still $1,000 per point but since they are half of a bond future tick, then they trade $15.625 per tick. The options are no different than equity options except the price per point/tick is different and you are only controlling one bond futures contract, as opposed to 100 shares of stock. You will also notice that the strike prices are every point. This should give us enough background to discuss the Utility trade.
There are weekly options on the bonds. Some platforms only offer the monthly options, so beware of that. We are looking for income, so we will be selling the options to bring in premium. We want the option to deteriorate over the time of the option. So if we sell a bond option at 16 (16/64) we will bring in $250. If we buy back the option at 5 (5/64), we pay $78.125 for it. The difference is the profit: 250-78.125 = $171.875. If we do this two to three times per month, this will generate $400 to $500 per month, per contract, to help pay the utilities.
To set up the trade, first we don’t want to risk more than $300 per contract in any trade. So if we sell an option at 16, then if it doubles or goes 19 ticks against us, we will get out of the trade. If using weekly options, we will not be bringing in much premium, so we will look for something between 10 and 20 ticks on the options ($150-$300), and look to get out between 0-5. Next we need to look at the trend of bonds. Here is a daily chart on the USM17 (June 2017, 30-yr Treasury bond future):
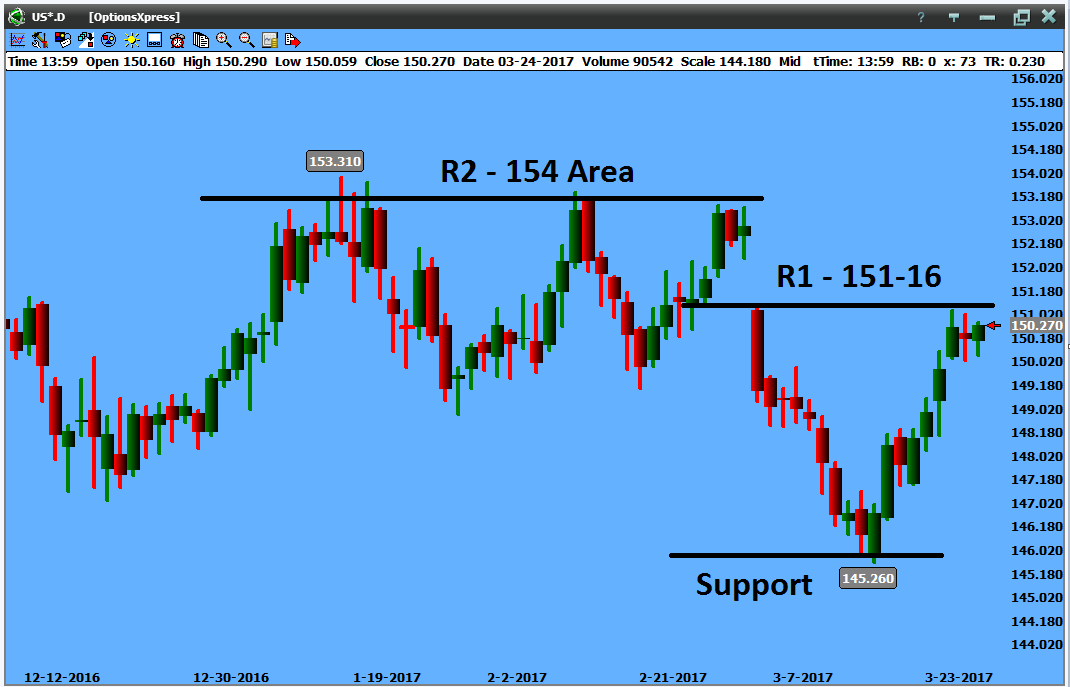
Notice bonds are in a downtrend, so selling call options will be the safest play since bonds will have a tendency to go down. We will try to sell options at the resistance point (R1 or R2). Of course, the closer it is to the resistance point the more premium that will be brought in and the further away from that point the less premium, unless we go out further in time. If your platform only does monthly options, then I’d use a resistance point further back, but if using weekly options, use the closest. Another thing to keep in mind, find out when the big economic news is coming out since bonds will react to it.
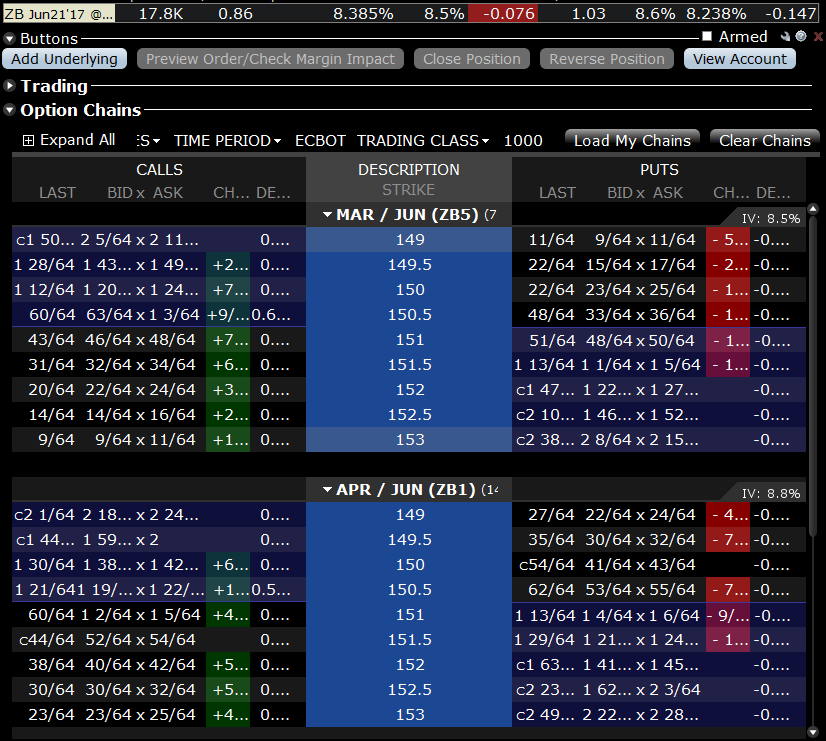
Look at the option chain below. Our R1 is around the 151-16 (151.50, since 16 is half of 32) strike. The Mar 31 call option is trading at 63/64. The 152.50 is at 15/64. The 152.5 is between the R1 and R2 on the chart and a little less risky since bonds have to rally another point to get to that strike. You have to make a decision on which option to sell. Let’s be a little more conservative and do the 152-50 strike. The current bid and offer are 14/64 – 16/64. If we put an order to sell at 15/64 and get filled, we will bring in about $234.38. If today is Mar 27 and bonds are trading at 150-27, we will have to wait 5 days for the option to expire. As long as the bond futures stay below 152-16 then the option will lose value each day. If there is a big economic news day this week, we will need to either get out and take the profit we have, or be ready to exit if the bonds rally off the news.
Doing this trade a couple of times a month can cushion the blow of the bills that come once a month. We can’t win them all, but remember, we will not risk more than $300 per contract soone loss will scratch one win and a half for the most part. If you have never traded options on bonds, paper trade it for a couple of weeks to see how it goes. Once you get the hang of it, start paying some bills.
We have walked through a couple of ways to bring in a little income and reduce the risk by financing the stops. Buying equities is a good thing, but being able to gain more on the position from using options can help boost the account. If we expand to trading options on futures, we can help pay those utilities a little and have more for the grandkids when they come over. Remember that there is always risk in trading and we will never be 100%. But taking a little loss is not so bad when the return is much greater. Good luck trading!