It’s Not Difficult To Learn Technical Analysis Strategies
During the last two days I presented basic techniques for beginners who want to learn technical analysis trading strategies. More specifically I focused on my favorite indicator the Exponential Moving Average or EMA for short. The first day I covered the basics of the indicator and demonstrated the difference between the Simple Moving Average (SMA) and the (EMA).
The EMA proved much more responsive to short term price fluctuations and demonstrated better response to momentum and volatility. You can see by looking at this chart how much more responsive the EMA can be compared to the SMA.
Please keep in mind that although I’m demonstrating this method with stocks, it applies to futures, commodities and currency markets just as well. And if you are a day trader, you can change the bars from daily to 5 minute and apply this method to E-mini Futures Contracts as well.
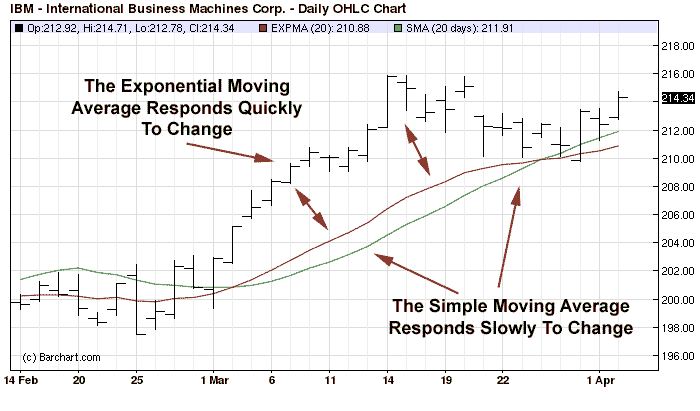
Notice How Much Faster The EMA Responds To Volatility
The Set Up
After demonstrating the effectiveness of the EMA compared to the SMA I adjusted the EMA to 20 look back twenty days. This gives me a good time frame and makes the EMA more responsive to short term market swings. You can experiment with different settings but I suggest you start off with the 20 day.
After adjusting the EMA to 20 days I demonstrated the precise entry method that we will use to enter the market using the 20 day EMA. The basic principle is to use the EMA to measure pullbacks away from the trend. We simply find a stock that’s trending strongly above the EMA, the more distance between the stock and the EMA the better the trend.
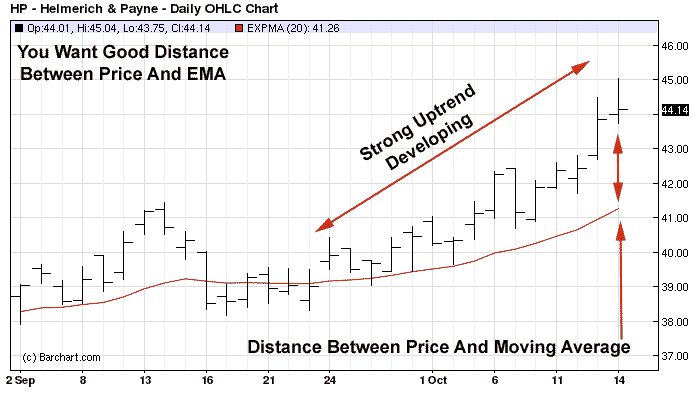
Look For Markets That Are Trending Strongly Above The EMA
The next step is to wait for the stock to trade completely below the EMA for 5 days or less. If the stock trades below the EMA for more than 5 trading days the trade is nullified and if the stock trades completely above the EMA within the 5 trading days you would enter a buy stop order above the first bar that trades completely above the EMA.
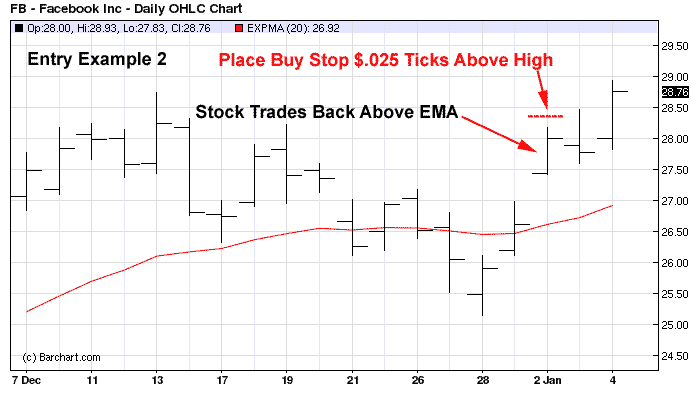
The Stock Only Traded One Day Below The EMA – Remember 5 Days Max
Placing Protective Stop Loss
The final step we covered yesterday was where to place your stop loss level so that random price fluctuations or market noise doesn’t cause you to be stopped out prematurely. My advice is to place your stop at the EMA level immediately between the last bar that traded completely below the EMA and the first bar that traded completely above the EMA. This may sound a bit confusing so take a look at this example for clarification.
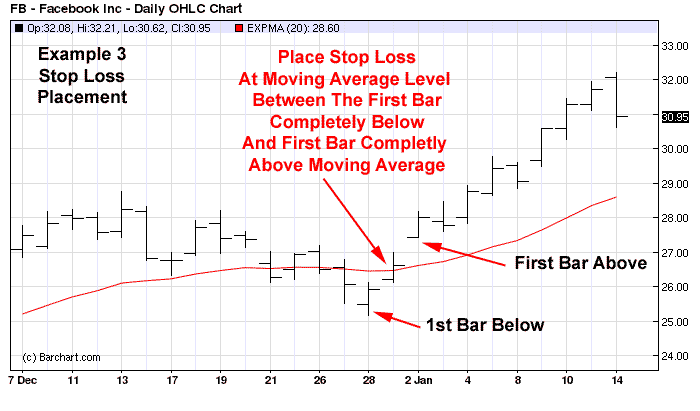
Place Your Stop Loss At The Exact EMA Level Between The Two Bars
Where To Place Your Profit Target
The final step is to strategically place your profit target and that’s something we will cover in today’s tutorial. You want to make sure and place your profit target at a level that provides you with a solid risk to reward level. Most professional traders use a profit to risk ratio of two to four. This means for every dollar you risk you should profit anywhere from two to four dollars.
This particular method is based on short term price momentum and volatility, therefore using a profit target that’s designed to keep me in the market for a long time will not work with this type of strategy. A good tip is to always plan your exits based on the characteristics of your entry method. I use a simple two to one risk level with this strategy. I want to see very strong momentum coming into the market as quickly as possible after I enter my order.
I simply measure the distance between my entry price and the stop loss level and multiply that number by two. I then add that amount to my entry price and that becomes my profit target for the trade. This ratio offers me a reasonable risk to reward ratio and provides me with an opportunity to take quick profits from the increase in volatility before the momentum dries up once again.
In this particular example the distance between my entry price and my stop loss level was approximately $2.25 cents. I would multiply that number by two and add that amount to my entry price, which in this particular case was $28.60. I then add $28.60 to $4.50 and my profit target in this particular case would be $33.10.
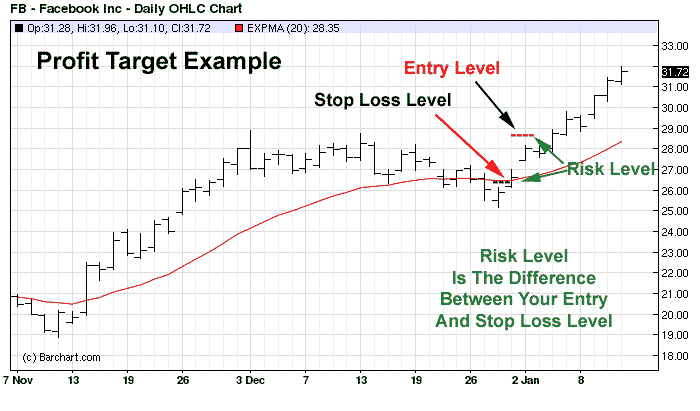
Always Calculate Your Risk Level Before You Enter The Trade
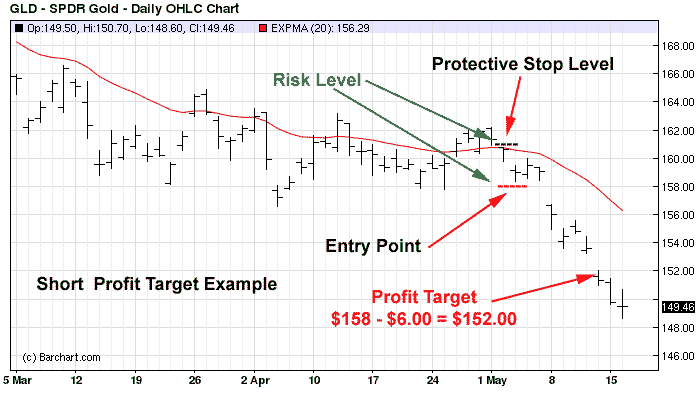
In this final example you can see exactly where the entry and the protective stop loss level are placed. Since we are selling short we would subtract our risk level from our entry and that would provide us with our profit target.

Subtract Your Risk Level From Your Entry Price
In this particular case the risk level on the trade equals $3.00. We would multiply that number twice and subtract it from our entry price. Since our entry was at $158.00 and our risk level was $3.00 we would subtract $6.00 from our entry price and that would provide us with a profit target level of $152.00 even.
Things To Keep In Mind
Always remember that pure momentum strategies that are based on volatility have lower profit to loss ratio than other technical trading methods.
Also remember that the 20 bar EMA can be adapted to any market and time frame. The only market I don’t recommend you trade using this method is options.