How To Choose The Best Chart Patterns
Today I want to discuss a few different chart patterns that beginners should focus on when they first start out day trading. Many traders start out with what I call indicator fascination and delve into advanced analysis methods that can confuse them and often times discourage them from continuing trading.
When I started out trading I was under the impression that the more difficult trading methods would produce bigger winners or higher probability of winning trades.
I purchased several books and magazines that discussed Gann Lines, Geometric calculations and Elliot Wave Principles that required a PhD in physics to understand correctly. It goes without saying but I can promise you that the only thing I learned after following these methods was to stay away from them as far as possible.
Profitable Day Trading Chart Patterns Should Be Simple
Fortunately, I met a few professional traders who mentored me and showed me some simple strategies that got me on the right track and more importantly made me understand that profitable trading is not about complex and confusing trading patterns or strategies but about finding simple methods that matched my emotional make up and my risk tolerance. So today, I’m going to show you a few basic day trading chart patterns that should get you started on the right track.
Always Begin With Daily Chart Patterns
The most fundamental mistake beginners make is beginning their search for chart patterns using intraday time frame. I always encourage traders to begin their analysis with daily time frame and then move on to intraday time frame when they are actually getting ready to enter the trade.
While there are some markets such as E-mini SP futures and Forex markets that you can begin analyzing using hourly or shorter time frame bars.
However, for the most part most financial instruments respond best to daily chart analysis to begin with. You can see in this example I’m looking at a symmetrical chart pattern set up. I want to wait for the initial breakout to occur so that I can day trade if the stock continues momentum after the breakout. Usually after a tight symmetrical triangle, the stock is very wound up and is ready for strong momentum that should last 2 to 5 days.
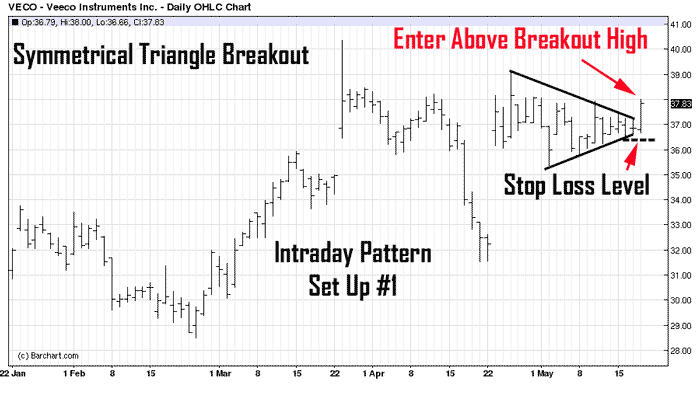
Symmetrical Triangles Offer Very Low Risk And High Profit Opportunity
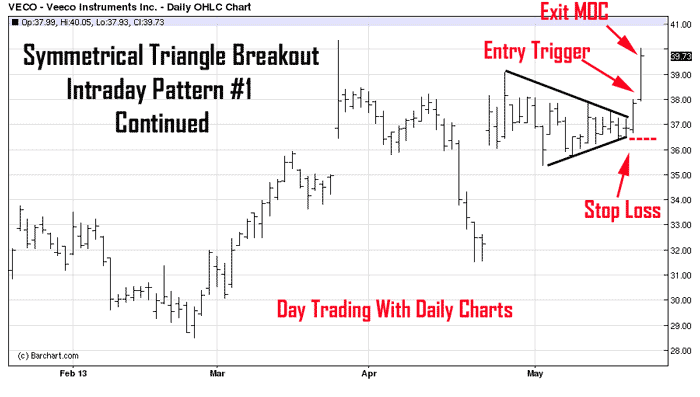
You can see the actual entry in this example. Notice I completely relied on the daily chart for my analysis, entry and exit. I do watch the intraday chart while I’m in the trade, I mostly focus on the daily chart to make sure the pattern is developing correctly.
In this case the triangle breakout continued upwards momentum and closed near the high of the day. I would use a simple MOC (market on close) order to liquidate the position at the end of the day. What I like about triangles is the inherently limited risk due to lack of volatility while the pattern is setting up. This is one of the reasons why triangles are good low risk high reward patterns for beginners.
Make Sure The Market You Choose Demonstrates High Volatility Before Entering The Triangle Pattern
The next low risk day trading chart pattern I want to show you is the bullish flag pattern. It’s similar to the triangle pattern but has a slightly wider channel range and typically slopes down a bit more.
Notice the risk level is equal to the size of the bars that make up the flag. I would look for a strong breakout day outside of the flag for an upside entry. Flags are congestion patterns that tend to explode with good momentum once the congestion phase comes to an end.
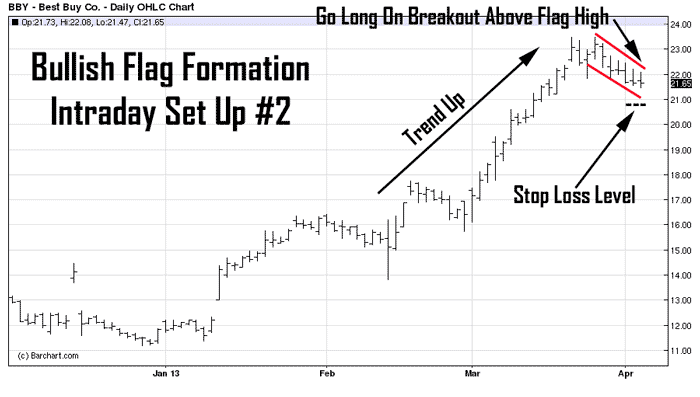
Breakouts From Bullish Flag Patterns Typically Begin With Strong Momentum
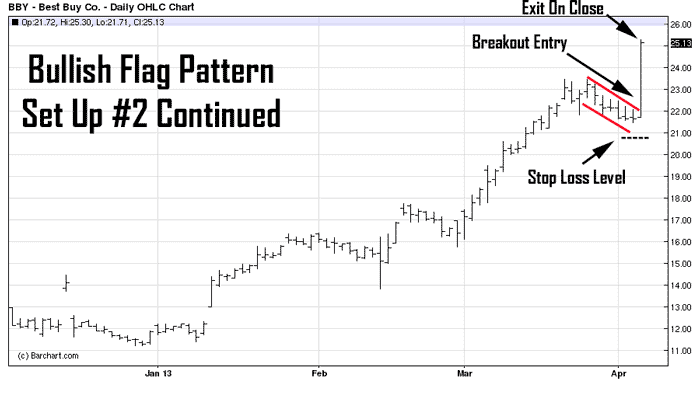
You can see the entire sequence in this example. Notice how low the risk level can be when the bars before the breakout are consolidating and have a tight trading range; these are the type of patterns you want to isolate for day trading.
The risk is very small compared to the profit potential and because your entering right after the consolidation stage the market is primed for volatility. The profit on this trade was close to three dollars and the risk level was close to one dollar.
Unfortunately, day trading does not provide opportunity for huge profits because you are limited to how much time your position has to develop. You should look for set ups that provide you with a two to one risk opportunity at a minimum.
The Stock Broke Out Strongly After Two Weeks Of Range Bound Trading
Things To Keep In Mind
Start Day Trading with simple patterns that make sense. Avoid difficult mathematical formulas or calculations that involve geometry or statistics.
Look for opportunities that provide high potential reward and low risk so that the size of the winners is at least twice the size of your losers.