POWERFUL IMPLICATIONS OF GAPS
How Do They Produce Profits With Candlesticks?
Gaps (Ku) are called windows (Mado) in Japanese Candlestick analysis. A gap or window is one of the most misunderstood technical messages. Most investment experts advise not to buy after a gap.
This is true only about ten percent of the time. The other 90% of the time, the gaps will reveal powerful high profit trades. Candlestick signals, correlated with the appearance of gaps, provide valuable profit-making set-ups.
What is the best investment you can make? Simple! Learning investment techniques that make you independent of having to rely on any other investment consultation. You can easily learn and quickly master common sense analysis that will dramatically improve your returns for the rest of your life. You will feel confident in every trade you put on. No more “hoping” that a trade will move in your direction. The unique built-in forces encompassed in the candlestick signals and the strength of a move revealed by the existence of a gap produce powerful trade factors. You can rest easy! Obtaining the knowledge that this combination of signals reveals will produce consistent and strong profits.
These are not “hidden” secret signals or newly discovered formulas that are just now being exposed to the investment world. These are a combination of widely known but little used investment techniques. Candlestick signals obviously have a statistical basis to them or they would not still be in existence after all these centuries. Gaps have very powerful implications. Combining the information of the two produces investment returns that very few investors take the time to exploit.
Dissecting the implications of a gap/window makes its appearance easy to understand.
Once you understand why a gap occurs at different points in a trend, taking advantage of what the gaps reveal becomes highly profitable. Where a gap occurs is important. The ramification of a gap in a chart pattern is an important aspect to Japanese Candlestick analysis. Some traders make a living trading strictly off of gaps.
Consider what a window or gap represents. In a rising market, it illustrates a price opening higher than any of the previous day’s trading range. (For illustration in this book, the “day” will be the representative time frame.) What does this mean in reality? During the non-market hours, something made owning this stock tremendously desirable.
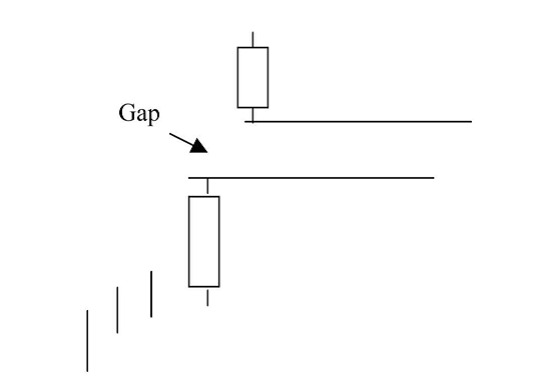
So desirable that the order imbalance opens the price well above the prior day’s body as well as the high of the previous day’s trading range. As seen in Figure 1, note the space between the high of the previous day and the low of the following day.
Figure 1 – Illustration of a gap.
Witnessing a gap or window at the beginning of a new trend produces profitable opportunities. Seeing the gap formed at the beginning of the trend reveals that upon a reversal of direction, the buyers have stepped in with a great amount of zeal. A common scenario is witnessing a prolonged downtrend. A Candlestick signal appears, a Doji or Harami, Hammer, or any other signal that would indicate that the selling has stopped. What is required to verify that the downtrend has stopped is more buying the next day. This can be more solidly verified if the next day has a gap up move.
Many investors are apprehensive about buying a stock that has popped up from the previous day’s close. A risky situation! Yet a Candlestick investor has been forewarned that the trend is going to change, using a signal as that alert. A gap up illustrates that the force of buying in the new upward trend is going to be strong. The enthusiasm shown by the buyers trying to get into the stock demonstrates that the new trend should have a strong move to it. Use that gap as a strength indicator.
Gaps occur in many different places and forms. Some are easy to see, some are harder to recognize. This chapter will focus on a few situations where a gap has appeared. Each situation will be explained in detail, (1) to give you a full understanding of what is occurring during the move and (2) to provide a visual illustration to become familiar with the formation, making it easy to recognize. This allows the Candlestick investor to spot an investment situation as it is developing.
GAPS AT THE BOTTOM
Knowing that a gap represents an enthusiasm for getting into or out of a stock position creates the forewarning that a strong profit potential has occurred. Where is the best place to see rampant enthusiasm? At that point, you are buying near the bottom. Obviously, seeing a potential Candlestick “buy” signal at the bottom of an extended downtrend is a great place to buy. In keeping with the concepts taught in Candlestick analysis, we want to be buying stocks that are already oversold to reduce the downside risk. What is better to see is the evidence that buyers are very anxious to get into the stock.
Reiterating the basics of finding the perfect trades, as found in my book “Profitable Candlestick Trading”, having all the stars in alignment makes for better probabilities of producing a profit. Consider the Housing construction industry mid September 200l. The indexes were bottoming out after the 9/11 debacle.
The Housing stocks indicated the best evidence of capital inflow. The initial move to the upside was evident with a large number of good signals found in those stocks after doing a scan of the charts. Investors were really liking the residential home builders. This is clearly seen in Figure 2 – CTX, Centex Corp. It gapped up the same day, illustrating that buyers were coming into this stock with a vengeance. The initial gap is very important. It will indicate how strong the new move will be.
Figure 2 – Centex Corp.
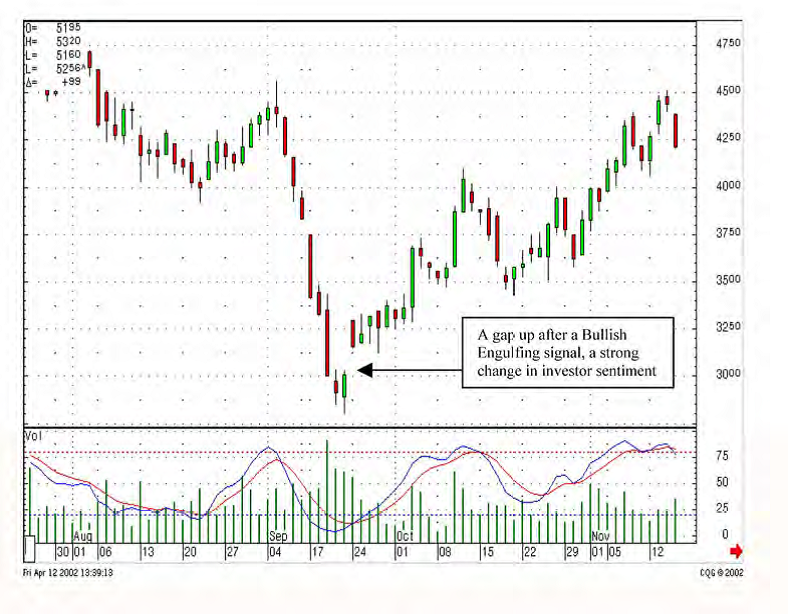
Upon witnessing a gap up, an individual signal, such as the dark candle in the above chart after the gap up, has less relevance. When a large gap occurs, it is not unusual to see immediate selling as the traders take their quick profits. The overall message is that the bulls are in strong. The next few days demonstrated that the price was not going to back off, the new trend had started.
The long-term investor, after analyzing the monthly chart, could have established a position, with the knowledge that funds were flowing into this sector with much more enthusiasm than other sectors, which could have been just rising with the overall tide. A great indication for where to position your funds!
MEASURING GAPS
A gap that occurs well after the beginning of a trend reversal, where stochastics are still in the midrange of an uptrend, has different implications. How do you distinguish whether a gap is a potential measuring gap? Evaluate where the stochastics are in the trend. If they are still relatively low, the trend has more room to create another gap before getting to the overbought area. Note in the CTX chart, Figure 3 – Centex, how the trend started with a small gap up. The next few days, another gap forms, in the midrange of this trend. The bears could not push prices back down through that gap over the next few days.
Figure 3 – Centex
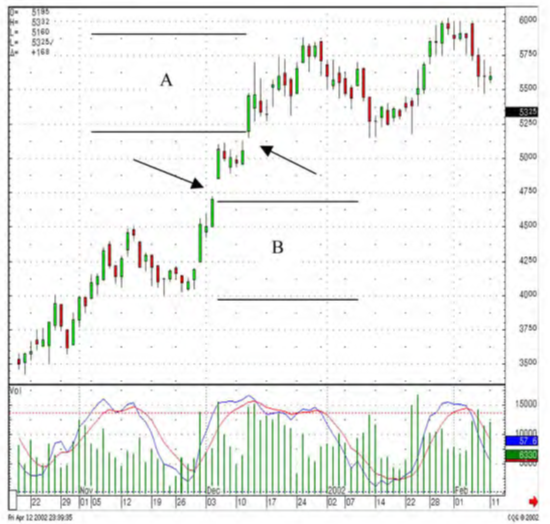
Eventually the bulls gapped up the price again. Notice that the beginning of the trend up to the first gap [B] is about the same price movement as the move after the second gap to the top of the trend [A]. This simple measurement gives the gaps their name. The telling ingredient is the fact that the bears could not push prices back down through the first measuring gap. That factor gives the bulls renewed confidence and they step back in. The next day they gap it up again due to not being afraid of the bear camp.
GAPS AT THE TOP
The gap that appears at the top of a trend is the one that provides the ominous information. Remembering the mental state of most investors, the enthusiasm builds as the trend continues over a period of time. Each day the price continues up, the more investors become convinced that the price is going to go through the roof. The “talking heads” on the financial stations start to show their prowess. They come up with a multitude of reasons why the price had already moved and will continue to move into the rosy future.
With all this enthusiasm around, the stock price gaps up. Unfortunately, this is usually the top. Fortunately, Candlestick investors recognize that. They can put on exit strategies that will capture a good portion of the price move at the top. Consider the different possibilities that can happen when witnessing the gap up at the top of a sustained uptrend. Most of the time the gap will represent the exhaustion of the trend, thus called an Exhaustion Gap. Or it could be the start of a Three Rising Windows formation. Or big news, a buyout or a huge contract is about to be announced.
What are the best ways to participate in the new potential, if there is any, at the same time knowing that the probabilities are that the top is in? A few simple stop-loss procedures can allow you to comfortably let the price move and benefit from the maximum potential. Hopefully, in the description of the gaps occurring at the exuberance of an extended trend, you have already experienced a substantial gain in the position. Any gap up is adding to an already big gain. Probabilities dictate that this is the top. Possibilities could include more upside gains.
Upon a slight to medium gap up, the Candlestick investor should put their stop at the close of the previous day. The thinking being that if the price gapped up, indicating that the top is in, and the price came back down through the close of the previous day, the buying was not sustained. If so, the stop closed the position at the level of the highest close in that trend.
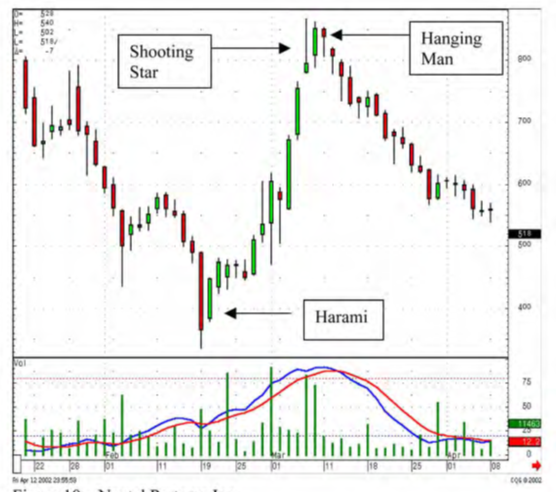
Look at Figure 4 – NXTP, Nextel Partners Inc. If you had bought the stock the day after the Harami signal, showing that the selling had stopped, the open may not have been the strength wanted to show that the buyers were stepping in. After the price opened lower the next day, not showing resumed buying, a good spot to put the “buy stop” would be at the closing price of the previous day. The thinking being that if the price, after opening lower, came up through the closing price of the previous day, then the buyers were still around. Buying price = $4.50.
After a few weeks, the price starts to accelerate and finally they gap it up. News was probably looking very rosy at this point. Now the Candlestick investor is prepared. Knowing that a gap up at the top indicates that the top is near, they can implement strategies to maximize profits. Most investors will know that their position is up almost 100% in three weeks.
That is not the type of move that will be missed by most. Upon seeing the bigger price days and volume picking up, the Candlestick investor will be ready for any sell signals that appear.
When the gap open appears, a number of strategies can be put in place. First, a stop loss can be put at the closing price of the previous day. If prices start falling off immediately and come down through the previous day’s close, then the bears have taken control. You are out at the high close of the uptrend. In this case, as the price moves up, it would be safe to put a stop at the open price.
Figure 4 Nextel Partners, Inc.
A fundamental change might be in progress. The same rationale as putting a stop loss at the previous day’s open, if the price comes back down to and/or through that level, the sellers probably have taken over control. Otherwise, if the stock price continues higher, it may stay in a strong spike move for the next few days. Knowing that the stochastics are now well into the overbought area, and the price was running up after a gap, selling one half of the position would be a prudent move. Probabilities say that this is near the top. There is always the low percentage possibility that new dynamics are coming into the stock price, an announcement of a new huge contract or a possible buyout offer, something new and different from the dynamic that ran the price up to these levels in the first place. A surge of buying may create a “Three Rising Windows” pattern, moving prices to much higher levels. The probabilities of this occurring at the top of a trend are very small but feasible.
Moving the stop losses up to each close or next day’s open price maximizes the potential profits from that trade.
As seen in NXTP, a Shooting Star formed, definitely a sell signal. If the price opened lower the next day, the position should be liquidated immediately. That is what the Shooting Star is telling you, that the sellers are showing up. The next day opened higher and stayed up all day. Things still look good. However a Hanging Man formation appears the next day. This is where the Candlestick investor should be thinking, “a Shooting Star, a sell signal, now a Hanging Man, another sell signal, be ready to get out.” The next day after the Hanging Man, a lower open should have instigated the liquidation of any remaining position. At worst, the average selling price should have been in the $8.10 area. The gap was the alert signal that positions should be liquidated. This trade produced an 80% return over three weeks. Now go find another bottom signal.
SELLING GAPS
Now turn the tables over. The same enthusiasm demonstrated by a gap to the upside is just as pertinent for sellers on the downside. A gap down illustrates the desire for investors to get out of a stock very quickly. Identifying clear Candlestick “sell” signals prepares the investor for potential reversals. The Doji at the top, Dark Clouds, Bearish Engulfing patterns are obvious signals to be prepared for further down moves. The Doji is the best signal to witness a trend reversal.
The Doji should stand out at the top of a trend just like a blinking billboard. Note the Doji at the top of the ISSI, Integrated Silicon Solution chart, Figure 5. The Candlestick investor would have already been prepared upon seeing that a Doji was forming that day as the close was getting near. At worst, the position should have been liquidated when the pre-market indications showed a weak open.
Figure 5 – Integrated Silicon Solutions
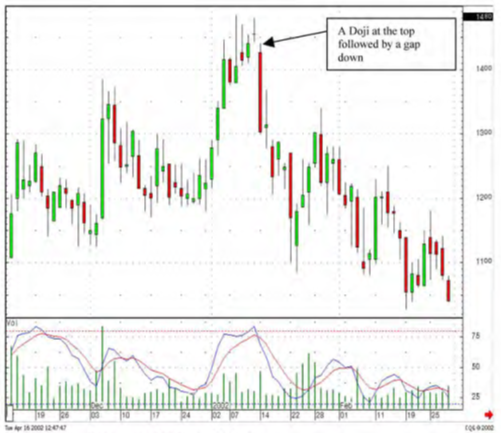
The existence of the gap down demonstrates an urgency to get out of this position. Being prepared for this event prevented giving back a major portion of profits.
GAPPING PLAYS
As always, there are exceptions to all rules. The Gapping Plays are those exceptions. As previously discussed, the gap at the top of a trend is the exhaustion gap. The same is said for the gap at the bottom of a trend. The appearance of those gaps is either the last gasp exhilaration (at the top) or the last gasp panic (at the bottom). However, the Gapping Plays represent a different set of circumstances at the top or bottom.
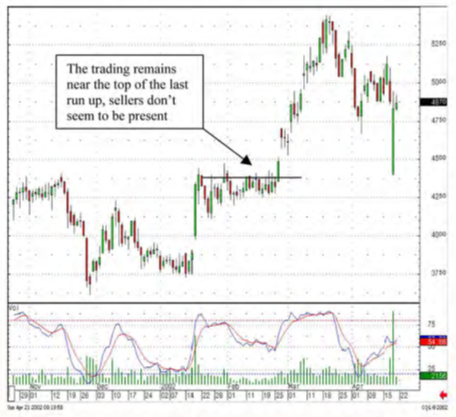
After a strong run up, it is not unusual to see a price back off and consolidate before the next leg up in a rally. This could be in the form of a back off in price or a backing off from further advance. The latter is a period of the price trading flat at the high end of the previous uptrend. After the flat trading period, a new burst of buying, causing a gap up, illustrates that the buyers have not been discouraged. This new buying is evident by the gap up. As a gap expresses enthusiasm, this is usually the reinstatement of the previous move, taking prices up to a new level.
As seen in Figure 6 – ITG, Investment Technology, the gap up after prices had stayed flat and at the top end of the last large white candle, for about a month and a half, finally convinced buyers that the sellers were not around. The gap up should have alerted the Candlestick investor that prices should be moving up to a new level. This becomes a High Level Gapping Play.
Figure 6 – Investment Technology
The same is true for a declining trend. After a significant downtrend, prices level out. Once the sellers are convinced that there are no buyers around to move the price up, they can sell again with confidence. This confidence is seen in the gapping down of price. At that point, much lower prices can be expected.
SUMMARY
Gaps have always played an important part in technical analysis. The movement away from the previous trading range signifies an extraordinary shift in investor sentiment. This shift can be more in the same direction as well as a complete reversal of the existing trend. Most important is that a gap has many ramifications. As illustrated in this chapter, gaps identify the force that can start a strong rally, or it can signify that final gasp of enthusiasm. The Japanese observed these movements over hundreds of years and accurately identified the results when combined with the signals.
With today’s computer capabilities, it is easy to do searches that specifically track gapping situations. Investing in these situations alone can make for a high-profit trading program. Putting the probabilities heavily in our favor, using Candlestick signals to identify a direction and a gap demonstrating inordinate force, will provide a source of profitable trades that no investment advisor is capable of doing. Most investors search years for an advisor, broker, newsletter, or guru that will lead them to consistently profitable trades. The well-versed Candlestick investor has a constant treasure trove for generating big profits. These are not hidden secrets. Yet, the combination of these investment tools have not been utilized by most investors. Having the backup of centuries of actual participation in this profitable combination takes the guesswork out of investment decisions.
The Candlestick Forum, www.candlestickforum.com. distinguishes itself from other Candlestick sites by enlightening investors to the actual implementation of profitable Candlestick trading strategies. Isn’t that the foremost purpose for your investment plan, finding the best possible places to put your funds?
Remember, these signals, formations, and philosophy are not the results of some quick, thrown-together back-tested investment program. The investment concepts portrayed in this chapter are the results of hundreds of years of visual observations confirmed with actual profitable experience. Once you have observed the results of a gap up discovered by your search, you will lose past thought processes such as “it is not wise to chase a stock”. A gap up is the indication that a new trend may be starting when it occurs at the bottom. It also warns the investor when the exhaustion buying is occurring, showing the end of the trend.
You can exploit profits that the common investor will shy away from. You will find profitable trades that most investors do not fully understand. Your wealth will be multiplied by common sense placement of funds, the same opportunities that the rest of the investment community has been advised to avoid.
You have this knowledge. Use it. If you are a member of the Candlestick Forum, utilize the expertise of the staff. If you have questions about a particular trade or formation, e-mail us. Why experiment when you can learn directly from decades of experience?