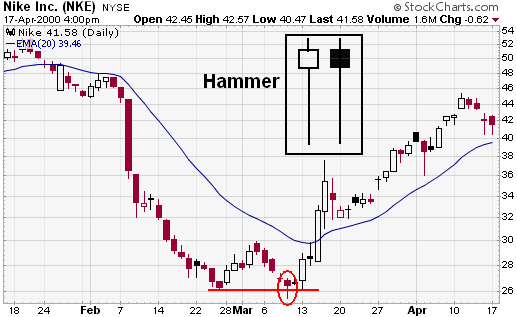
One of the most visually compelling candlestick patterns is the hammer signal. This signal is easily recognized by the lower shadow also known as the tail that protrudes to the downside after an extended downtrend.
The hammer signal is comprised of one candle and it is easily identified by the presence of a small body with a shadow at least two times greater than the body. It is found at the bottom of a downtrend and this shows evidence that the bulls started to step in. The color of the small body is not important but a white or green candle has slightly more bullish implications than a black or red body. A positive day is then required the following day to confirm this signal.
Profit ‘Big-Time’ From Trading With Candlesticks
Get In Depth Analysis and Training On The 12 Major Candlestick Signals
That Identify HUGE Profit Opportunities In All Types Of Trading Markets
Click Here to Access Stephen Bigalow’s Training

Criteria for the hammer signal
- The lower shadow should be at least two times the length of the body.
- The real body is at the upper end of the trading range. The color of the body is not important although a white or green body should have slightly more bullish implications.
- There should be no upper shadow or a very small upper shadow.
- The following day needs to confirm the hammer signal with a strong bullish day.
Signal Enhancements
- The longer the lower shadow the higher the potential of a reversal occurring.
- A gap down from the previous day’s close sets up for a stronger reversal move as long as the day after the Hammer signal opens higher.
- Large volume on the Hammer day increases the chances that a blow-off day has occurred.
Pattern Psychology
After a downtrend has been in effect the atmosphere is very bearish. The price opens and starts to trade lower. The bears are still in control but the bulls then step in and they start to bring the price back up towards the top of the trading range. This creates a small body with a large lower shadow and represents that the bears could not maintain control. The long lower shadow now has the bears questioning whether the decline is still intact and a higher open the next day would confirm that the bulls had in fact taken control.
Take advantage of the benefits that Japanese Candlestick trading provides. Opportunities are easily identified and someone will take advantage of the information the signals provide even if you don’t. Once you learn the valuable benefits revealed by Candlestick formations the rewards will be overwhelming.