MARKETS
Before you can be a successful trader you need to understand how the market works. You don’t need to be an expert, but you must know what drives the market. All markets we will be dealing with are auction markets meaning that you have bids and offers and when they are accepted by the other side of the trade a transaction takes place and the market is in equilibrium. It might only stay at that price for a couple of seconds before moving on but when the buyer and seller agree this process is called “price discovery”.
It is important to understand that in an auction market there must be a buyer for every seller. When the price is going higher it is not because there are more buyers in the market than sellers, it is because the buyers are willing to pay more for each trade. The same is true when the market is breaking, there are equal buyers and sellers in this case the sellers are willing to take less for their security and the price moves lower.
Option markets work the same as equity markets they rely on an auction process in which the various strike prices are part of the option market. The difference is that you have calls that can be bought when you believe the market is rallying and puts that can be sold when you think the market is breaking. You can also sell calls when the market is breaking and sell puts when the market is rallying. However, when you sell naked options you always have unlimited risk. Let’s go to review the option model so that we can figure out what trades we can use.
OPTION MODEL
The option model is what is known as a bell-shaped curve. The bell-shaped curve used by most traders is the Black-Scholes model and is named after the authors of a paper that describe how price of one strike relates to the price of another strike as time moves toward expiration. So, it is in fact a probability model based on where the current price of the underlying security is trading. The model is the same for all liquid stocks the only difference is the price of the underlying security.
The top of the model is known as the AT THE MONEY (ATM) strike and is the most important strike price of the model. It will always correspond to the underlying price of the security. More importantly it contains the most premium and has no intrinsic value. The put and the call have an equal chance of ending up in the money, so they will have the exact same value.
If the underlying security is trading at $200 then the ATM will be the 200 strike and if the put is trading at $5 the call will also be trading at $5. They both will have an equal chance of being in the money at expiration. As we move further from the ATM each strike will have some premium and some intrinsic value until we move so far from the
ATM strike that the probability of the option finishing out of the money will fall to near zero and the Call or Put at that strike will have no premium, it will be referred to as a parity option. For each tick the underlying stock moves up or down the in the moneyoption moves up or down. The out of the money option doesn’t move at all as it is too far away from the current price to have much of a chance of ever ending up in the money.
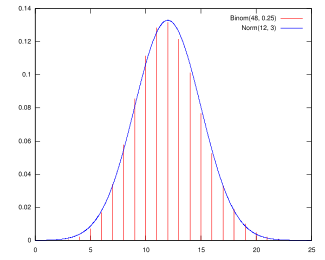
Figure 1 shows how the bell shape curve works. At the top of the figure is the ATM strike. As the red lines move further away they represent the strikes as they move away from the ATM. You will notice that each strike shorter than the one before it. That means the probability of the out of the money option ending up in the money at that strike is less than the one before, but that makes logical sense. Finally, the curve has lines are almost zero, and we reach parity and the out of the money option reaches zero.
OPTION CHAIN
When you trade you will not use the probability model but instead you will use an option chain. All brokers have an option chain for execution. None of the platforms will be exactly the same but they will look like the one exhibited on the next page. It will give you the last price of the equity and the time at which it is trading. It will allow you to compare many types of data. Some will be very useful such as volatility and volume which will help you to decide if you are dealing in a liquid set of options. Other data may help you to decide whether you want to go long or short the market.
I would warn you against using the data that will tell you how a spread will perform given the volatility. That tool is based on the options expiration and does not track what can happen in between executing the trade and what the result will be. It is a theoretical tool and many novice traders make the mistake of believing that is an excellent way to manage their trades only to find out the price may move in many directions before the options expire, and that the tool that tells the results is virtually useless in examining certain trades.
In addition to having the expiring serial all serials that are traded in the underlying security will be listed. Most option chains will allow you to collapse the size of the serials so that you don’t use up too much space on your computer screen.
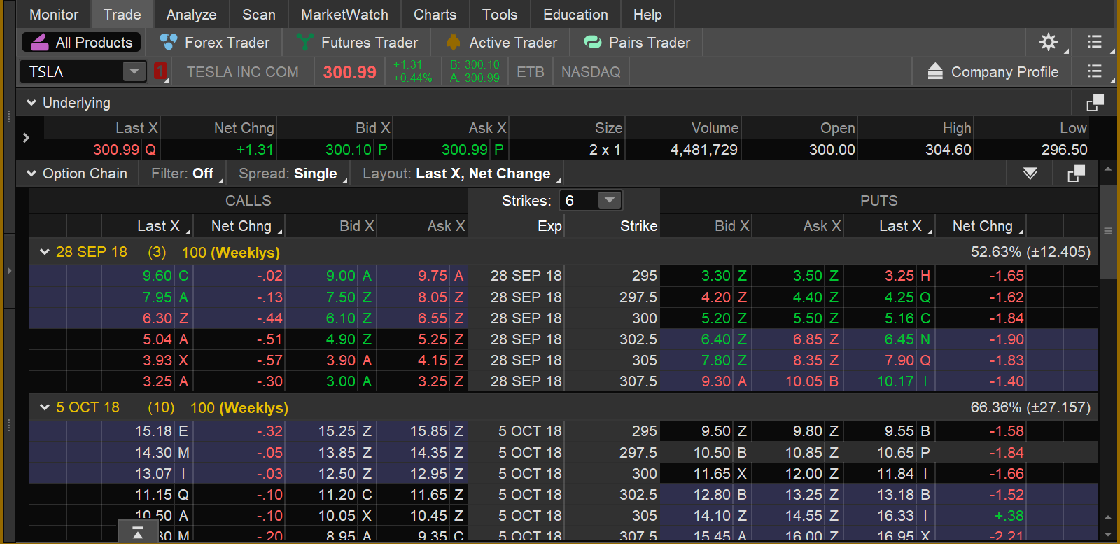
Figure 2 TSLA Option Chain
This is the way the parabolic curve would look on Tesla Motors. You can see that TSLA was trading at $300.99 so the 300 straddle would be the ATM. Since the call is .99C in the money the call would have .99c of intrinsic value the rest of the price would be premium. The put will be all air and the combination of the two will be called the ATM straddle. As you move higher or lower in price the option chain will look like the theoretical model with each successive strike having more intrinsic value and less air until you reach a point where there is no premium left in the model.
WHY IS THIS SO IMPORTANT
It is so important because it is the basis for all of the trades I am going to teach you. If you don’t understand how the option model works the trades will look like gibberish to you. The Option model is flexible and the ability to understand “where you are at in the market “ after a trade has been put in place is vital to making a profit trading options. Before you go on to the section on trading please review the information that is being presented. Study the option model in TSLA as we will use that at the basis for all of our trades.
When you have completed your study, go to the section on trades and it will explain which strikes to use for different trades and how to execute the trade both getting them on and then taking them off!
TRADING WEEKLY OPTIONS
In my opinion weekly options offer the best opportunity for retail traders to make money in the option market. Why sell a vertical put spread on a monthly or quarterly basis when you can sell it for a few cents less and do it 52 times a year? You have almost the same probability of cashing your weekly ATM trade as you do if you take an ATM trade once a year, the difference is you sell almost 50 times as much premium with approximately the same risk!
Now that you have a basis for your trading model I will produce the trades that I believe will help you in any phase of investing or trading. I will talk about why I make certain trades but avoid other trades. What you can expect from the trades and how much capital you will need to overcome the inevitable losing streaks that accompany trading. There is no silver bullet when it comes to trading, there is no such thing as 98% winners with little risk. If you believe that you can produce those trades you are wrong, don’t even read the following section because it will be of no help to you. However, if you are interested in trades that will give you a chance to either enhance yield on your portfolio or allow you a speculative chance to win then this course will be for you.
TRADE 1: WEEKLY VERTICAL SPREADS
The first trade that we will discuss is the vertical spread. A vertical spread is initiated to take advantage of price movement around the ATM strike. There are two types of vertical spreads. The first one is the debit spread. When you use a debit, you are trying to predict the direction of price movement. It is created by buying an option closest to the ATM strike and then selling an option that is further away. It is limited risk limited reward trade. The problem with the debit spread is that not only do you have to be right as to the direction of price you must overcome the debit that you used to create the spread.
Looking at our TSLA option chain, let’s say that we think that the price of TSLA is going to rally and we want to take part. We decide to buy the ATM, ATM+2 call debit spread. Currently the ATM call (300 strike) is trading around $6.30 and the ATM +2 (305 strike) is trading around $3.95. So, if we want to initiate a spread we can pay $6.30 – 3.95 and be long the debit spread for around $2.35. Our maximum risk in this trade is our debit of $2.35 and our maximum reward is $2.65. The maximum risk in a debit spread is always what we paid for it, the maximum reward is the difference between our debit and the strike price differential, in this case it is $5.00 wide, so our reward could be $2.65.
THE PROBLEM WITH WEEKLY DEBIT SPREADS
The problem with a debit spread is that not only do you have to be right as to the direction of the market you must be correct as to how far it will move. When we put this trade on TSLA was trading around $300.99 so the spread had .99 c built in as profit. However, if TSLA continues to rally but only goes as high as $302 we lose .65. If it doesn’t rally at all we lose $1.66 and if it breaks we lose the entire spread. I don’t teach debit spreads for that reason. It is hard enough to pick a direction that the market is going to go let alone have to pick how far it will advance. Nothing in trading is worse than being right on market direction and still lose money.
WEEKLY CREDIT SPREADS
Vertical credit spreads are the opposite of a vertical debit spread. They are used to generate income in two ways. First of all is time decay (theta) and second is price movement. The spread can be used by itself or it can be combined with other strategies to create more complicated positions. We will always use the ATM plus a combination of other strikes (ATM +1,+2,+3, or ATM-1,-2,-3, to create the spread. We know that the ATM will always have the most premium, so we want to sell the option that is closest to the ATM and buy one further away to create our spread.
Using a mirror image of the TSLA debit trade to initiate a credit spread we can sell the ATM (300 strike) for around $6.30 and buy the ATM (305 strike) +2 strike for around $3.95 giving us a $2.35 credit, which is our maximum reward. Our maximum risk in this trade is $2.65, the debit side of the $5.00 trade. This is where the Credit and debit spreads completely change. With the vertical debit spread you must be correct as to which direction price will go, and not only that you must have it go far enough in your favor to overcome the debit that you paid for it. The vertical weekly credit spread has none of those characteristics. With the vertical credit spread you make money if the price goes in your direction. You make money if the price remains unchanged (theta) and you also make money if the price goes against you, but by less than the credit that you sold it for! It is the only trade I know of in any equity or option where you make even if you are wrong!
INITIATING A WEEKLY VERTICAL CREDIT SPREAD
There are several ways to initiate a Credit spread, in this section we will review the best and worst way to start the trade.
The first way the spread can be put in place is to “leg” the spread. This term means that you put one leg on naked and then try to capture the other leg at a better price. Personally, I don’t use this means, but if you want to try it then there is a way it must be put on. You must buy the long leg of the spread first, this gives you limited loss and unlimited profit. If you try to leg it using the short side you create a situation of unlimited risk and limited reward. Believe me after doing this for 25 years I can tell you the impossible will happen all of the time and it will happen to you. Something will happen before you can get your protection in place and you will take a potential $300 risk and turn it into a $3,000 loser.
The second way is to put the spread on is to do it as one trade. Remember that there are traders in the market that have the opposite view of you and they are also trying to get the spread on. Your software should have a method of putting on the spread that you want, and it will try to match it up with the other side of the market. This is the easiest way to do the trade and it is how I suggest you do it.
Let’s go back to our TSLA model and initiate a vertical put credit spread (bullish) using the numbers that are in our option chain.
Our first step is to figure out what strikes we want to use. Normally we want to sell the strike closest to the ATM underlying stock. With TSLA trading at 300.90 the closest strike is the 300. So, we know we want to sell the 300 strike. However what strike do we want to buy? This is where we get into what I call “Traders Choice”. We can buy any strike above the 300 as our protection but the wider we spread the strikes the greater risk we assume. Of course, if our risk is greater, then our reward will be greater.

Figure 3 TSLA Option Chain
For this example, we will sell the ATM strike (300) and buy a strike below it. Let’s use the ATM -2 strike (295) to create our spread. Once again I want to emphasis that you can use any two strikes that you want, but we use the ATM and the ATM -1,-2,-3,-4 or if we are bearish we use the ATM +1,+2, +3, +4.
The 300 put is trading $5.30 and the 295 put is trading around $3.30 so we will do the spread for around $2.00. Our maximum reward is the $2 credit we wrote the spread for and our maximum risk is $3 the difference between the credit and the distance between the two strikes (300-295= 5). If the market settles above $3.00 we will make our maximum gain, of $2.00, if it settles above $2.98 we will break even or make a slight profit. If it settles below 295 we will have a maximum loss of $3.00.
The Bearish Vertical credit spread is the exact mirror image of the Bullish spread and is initiated the same way, but we use the ATM and ATM+1,+2,+3 instead of the ATM -1,-2,-3,
TAKING OFF A VERTICAL CREDIT SPREAD
We now know how to put the vertical credit spreads on, but we have to learn how to take them off. There are only three ways to do that.
1) Both sides of the spread expire worthless. Do nothing the spread has taken itself off.
2) If both legs end up in the money you have two choices, first you can buy back the spread and it will be off, second you can go thru assignment and exercise over the weekend and the spread will come off and your account will be flat on Monday morning.
3) If one leg ends up in the money and the other ends up out of the money, You must buy back or sell the option that is in the money so that the spread will come off and you will be flat on Monday.